Technical Analysis of EVHY 2024-05-10
Overview:
In analyzing the technical indicators for EVHY over the last 5 days, we will delve into the trend, momentum, volatility, and volume indicators to provide a comprehensive outlook on the possible stock price movement in the coming days. By examining these key indicators, we aim to offer valuable insights and recommendations for potential investors.
Trend Indicators:
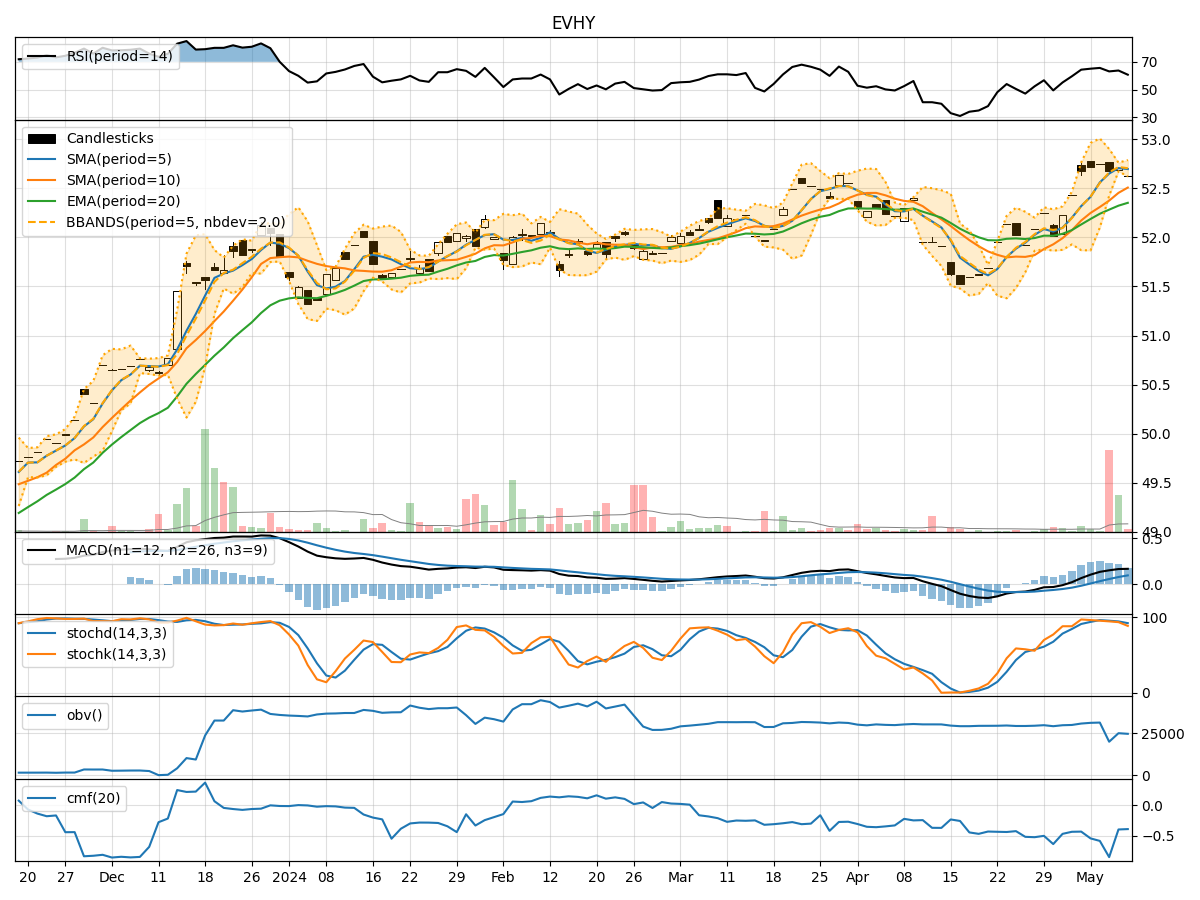
- Moving Averages (MA): The 5-day moving average has been consistently above the simple moving average (SMA) and exponential moving average (EMA), indicating a short-term uptrend.
- MACD: The MACD line has been above the signal line, with both lines showing an upward trend, suggesting bullish momentum.
- MACD Histogram: The histogram has been increasing over the past 5 days, indicating strengthening bullish momentum.
Momentum Indicators:
- RSI: The Relative Strength Index (RSI) has been in the range of 60-70, indicating a neutral to slightly bullish momentum.
- Stochastic Oscillator: Both %K and %D have been declining, moving towards oversold territory, signaling a potential reversal in the short term.
- Williams %R: The Williams %R is in oversold territory, suggesting a possible buying opportunity.
Volatility Indicators:
- Bollinger Bands: The stock price has been trading within the Bollinger Bands, with the bands narrowing, indicating decreasing volatility.
- Bollinger %B: The %B indicator is hovering around 0.5, suggesting the stock is trading near the middle of the bands.
Volume Indicators:
- On-Balance Volume (OBV): The OBV has been negative over the last 5 days, indicating distribution and selling pressure.
- Chaikin Money Flow (CMF): The CMF has been consistently negative, reflecting a lack of buying interest and potential weakness in the stock.
Conclusion:
Based on the analysis of the technical indicators, the stock of EVHY is likely to experience sideways consolidation in the coming days. The trend indicators suggest a short-term uptrend, supported by the MACD and moving averages. However, the momentum indicators show signs of potential reversal with the stochastic oscillator and Williams %R pointing towards oversold conditions. The volatility indicators indicate decreasing volatility, while the volume indicators reflect selling pressure and lack of buying interest.
Recommendation:
Considering the mixed signals from the technical indicators, it is advisable for investors to exercise caution and closely monitor the stock's price action. Traders may consider waiting for clearer signals or confirmation of a new trend before making significant trading decisions. Long-term investors should focus on fundamental analysis to complement the technical outlook and make informed investment choices.