Technical Analysis of EVLN 2024-05-10
Overview:
In analyzing the technical indicators for EVLN stock over the last 5 days, we will delve into the trend, momentum, volatility, and volume indicators to provide a comprehensive outlook on the possible stock price movement in the coming days. By examining these key indicators, we aim to offer valuable insights and predictions for potential investors and traders.
Trend Indicators:
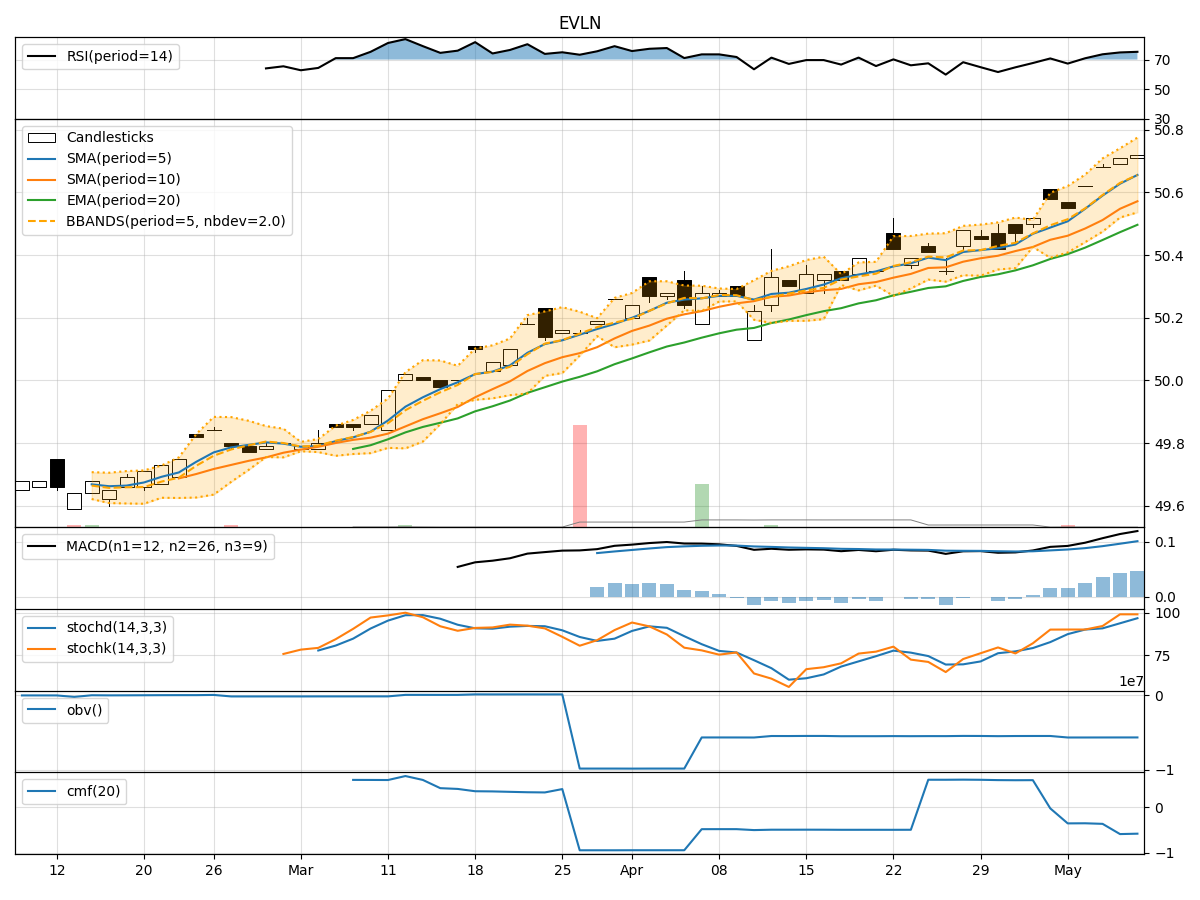
- Moving Averages (MA): The 5-day moving average has been consistently above the simple moving average (SMA) and exponential moving average (EMA), indicating a bullish trend.
- MACD: The MACD line has been consistently above the signal line, with both lines showing an upward trend, suggesting bullish momentum.
- Conclusion: The trend indicators point towards an upward movement in the stock price.
Momentum Indicators:
- RSI: The Relative Strength Index (RSI) has been in the overbought territory, indicating strong buying momentum.
- Stochastic Oscillator: Both %K and %D lines of the Stochastic Oscillator have been in the overbought zone, signaling a strong bullish momentum.
- Conclusion: Momentum indicators suggest a bullish sentiment in the market.
Volatility Indicators:
- Bollinger Bands (BB): The stock price has been trading within the upper Bollinger Band, indicating high volatility.
- Conclusion: Volatility indicators suggest that the stock price may experience high volatility in the coming days.
Volume Indicators:
- On-Balance Volume (OBV): The OBV has been showing a slight decrease, indicating a divergence between price and volume.
- Chaikin Money Flow (CMF): The CMF has been negative, suggesting a bearish pressure on the stock.
- Conclusion: Volume indicators imply a bearish sentiment in the market.
Overall Conclusion:
Based on the analysis of trend, momentum, volatility, and volume indicators, the overall outlook for EVLN stock in the next few days is as follows: - Trend: Upward - Momentum: Bullish - Volatility: High - Volume: Bearish
Final Recommendation:
Considering the bullish trend and momentum, coupled with high volatility, investors may witness upward movements in the stock price in the coming days. However, the bearish sentiment in volume indicators suggests caution, as there might be some consolidation or pullback before further upward movement. Traders should closely monitor the price action and key support/resistance levels for strategic entry and exit points.