Technical Analysis of EVMT 2024-05-10
Overview:
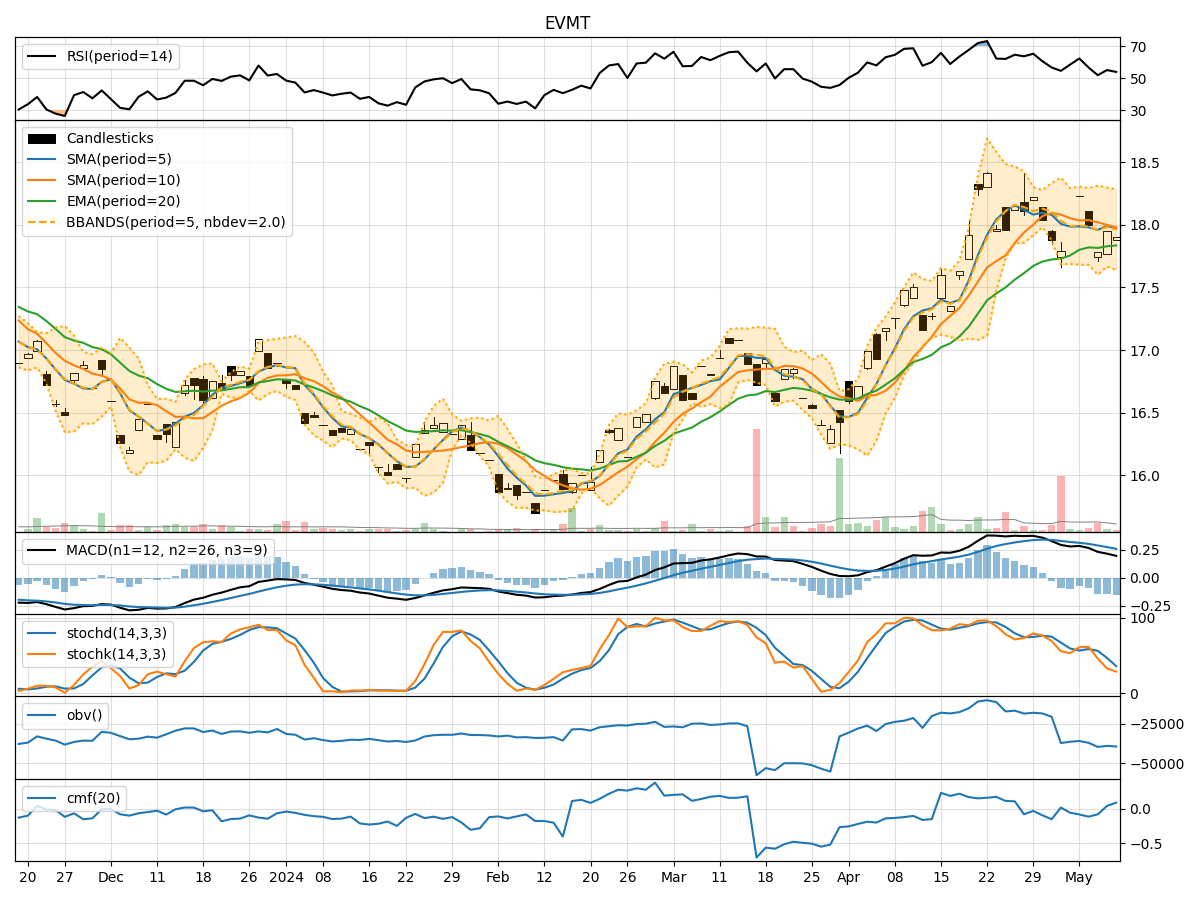
In analyzing the technical indicators for EVMT over the last 5 days, we will delve into the trend, momentum, volatility, and volume indicators to provide a comprehensive outlook on the possible stock price movement in the coming days. By examining these key indicators, we aim to offer valuable insights and predictions for potential investors.
Trend Indicators:
- Moving Averages (MA): The 5-day MA has been fluctuating around the 18.00 level, indicating a relatively stable trend in the short term.
- MACD: The MACD line has been positive, suggesting a bullish momentum in the stock price.
- MACD Histogram: The MACD Histogram has been decreasing, indicating a potential slowdown in the bullish momentum.
Momentum Indicators:
- RSI: The RSI has been hovering around the 50 level, suggesting a neutral momentum in the stock.
- Stochastic Oscillator: Both %K and %D have been declining, indicating a bearish momentum.
- Williams %R: The Williams %R is in oversold territory, signaling a potential reversal in the stock price.
Volatility Indicators:
- Bollinger Bands: The stock price has been trading within the Bollinger Bands, indicating a period of consolidation.
- Bollinger %B: The %B indicator is below 1, suggesting the stock is trading below the lower Bollinger Band.
Volume Indicators:
- On-Balance Volume (OBV): The OBV has been declining, indicating selling pressure in the stock.
- Chaikin Money Flow (CMF): The CMF has been negative, suggesting a lack of buying interest in the stock.
Key Observations:
- The trend indicators show a mixed signal with a stable MA but a potential slowdown in bullish momentum according to the MACD Histogram.
- Momentum indicators indicate a neutral to bearish sentiment, with the Stochastic Oscillator and Williams %R signaling a potential reversal.
- Volatility indicators suggest a period of consolidation with the stock trading within the Bollinger Bands.
- Volume indicators point towards selling pressure and a lack of buying interest in the stock.
Conclusion:
Based on the analysis of the technical indicators, the stock of EVMT is likely to experience further downside movement in the coming days. The bearish momentum indicated by the Stochastic Oscillator and Williams %R, coupled with the negative OBV and CMF, suggests a lack of buying interest and potential selling pressure. Additionally, the potential slowdown in bullish momentum according to the MACD Histogram raises concerns about a possible reversal in the stock price. Therefore, investors should exercise caution and consider waiting for more favorable technical signals before considering any long positions in EVMT.