Technical Analysis of EVNT 2024-05-10
Overview:
In analyzing the technical indicators for EVNT over the last 5 days, we will delve into the trend, momentum, volatility, and volume indicators to provide a comprehensive outlook on the possible stock price movement in the coming days.
Trend Indicators:
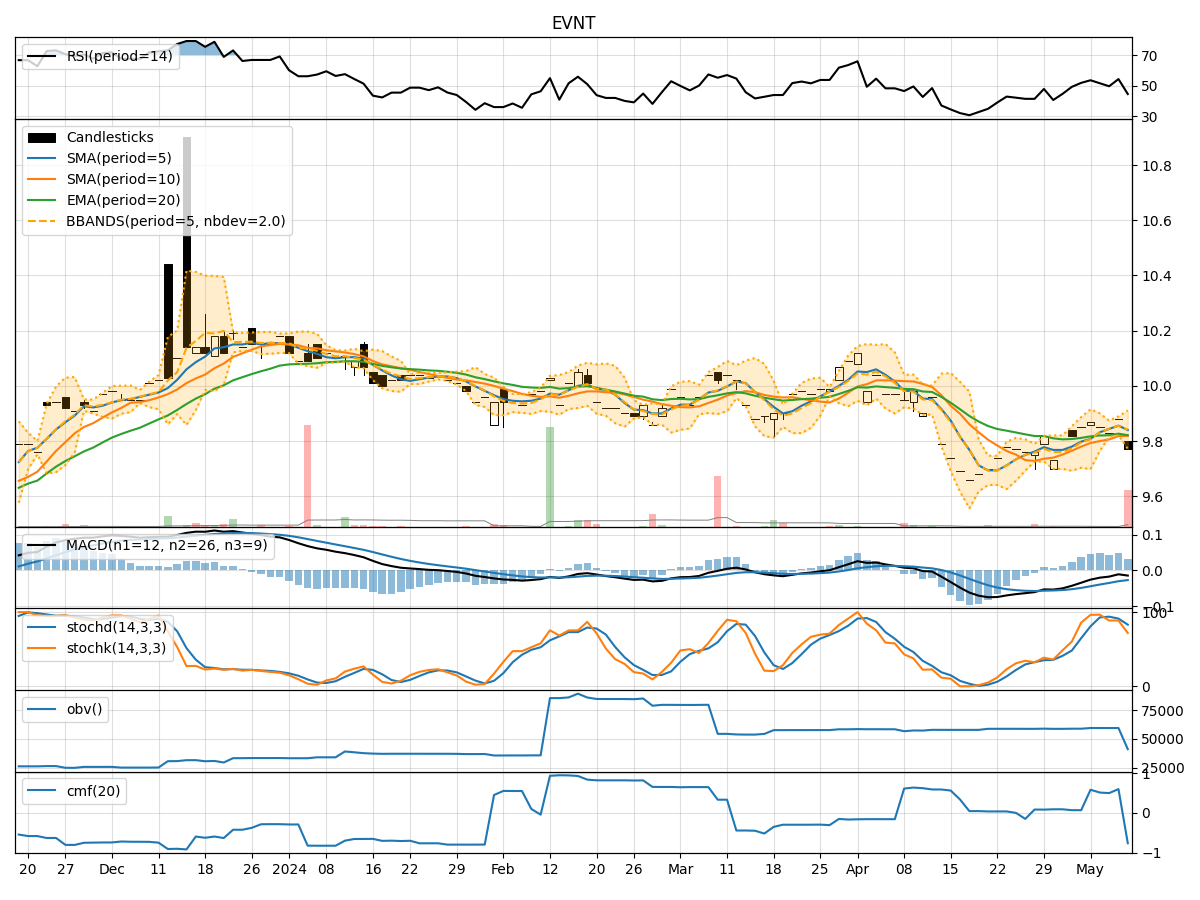
- Moving Averages (MA): The 5-day MA has been fluctuating around the closing prices, indicating short-term price trends. The Simple Moving Average (SMA) and Exponential Moving Average (EMA) show a slight downward trend, with the EMA slightly below the SMA.
- Moving Average Convergence Divergence (MACD): The MACD line has been consistently negative, indicating a bearish trend. The MACD Histogram has been decreasing, suggesting a weakening bearish momentum.
Momentum Indicators:
- Relative Strength Index (RSI): The RSI has been fluctuating around the 50 level, indicating a lack of strong momentum in either direction.
- Stochastic Oscillator: Both %K and %D have been declining, moving towards oversold territory, suggesting a potential reversal in the near future.
- Williams %R (Willams %R): The Williams %R has been in oversold territory, indicating a possible buying opportunity.
Volatility Indicators:
- Bollinger Bands (BB): The stock price has been trading within the Bollinger Bands, with the bands narrowing, indicating decreasing volatility.
- Bollinger Band %B (BB %B): The %B indicator has been hovering around the middle, suggesting a balanced market sentiment.
Volume Indicators:
- On-Balance Volume (OBV): The OBV has been fluctuating, indicating mixed buying and selling pressure.
- Chaikin Money Flow (CMF): The CMF has been negative, indicating a bearish money flow trend over the past 20 days.
Key Observations and Opinions:
- Trend: The trend indicators suggest a slight bearish bias in the short term.
- Momentum: Momentum indicators show a lack of strong momentum, with potential for a reversal.
- Volatility: Volatility has been decreasing, indicating a possible period of consolidation.
- Volume: Mixed volume indicators suggest indecision among market participants.
Conclusion:
Based on the analysis of the technical indicators, the next few days for EVNT stock price movement could see sideways consolidation with a slight bearish bias. Traders should watch for potential reversal signals from the stochastic oscillator and Williams %R, while keeping an eye on the narrowing Bollinger Bands for a breakout indication. It is advisable to wait for clearer signals before making significant trading decisions.