Technical Analysis of EVSB 2024-05-10
Overview:
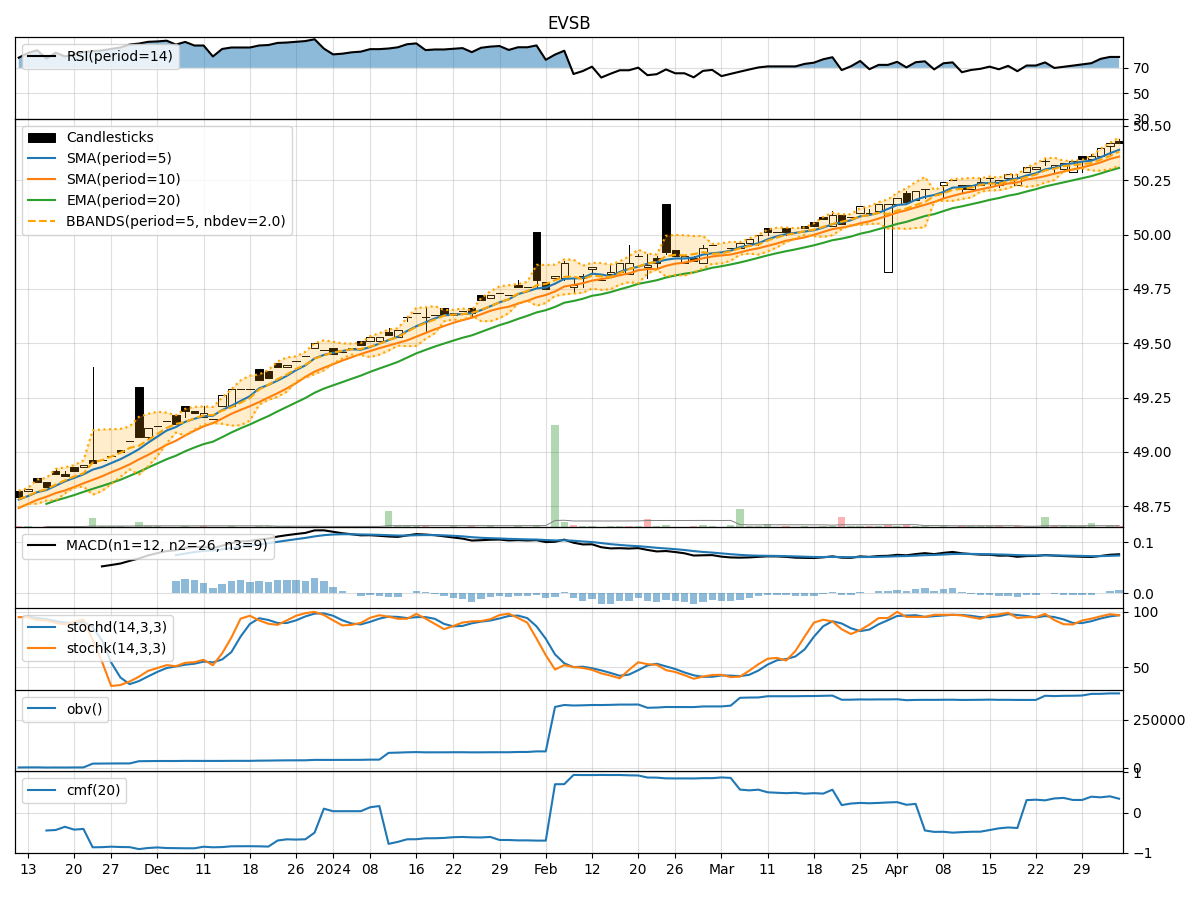
In analyzing the technical indicators for EVSB stock over the last 5 days, we will delve into the trend, momentum, volatility, and volume indicators to provide a comprehensive outlook on the possible stock price movement in the coming days. By examining these key indicators, we aim to offer valuable insights and predictions for potential investors.
Trend Analysis:
- Moving Averages (MA): The 5-day MA has been consistently above the 10-day SMA, indicating a short-term bullish trend. The EMA(20) has shown a gradual uptrend, suggesting positive momentum in the stock price.
- MACD: The MACD line has been above the signal line, with both lines showing an upward trajectory. This signals a bullish momentum in the stock.
Momentum Analysis:
- RSI: The RSI has been consistently above 70, indicating overbought conditions. This suggests a potential reversal or consolidation in the stock price.
- Stochastic Oscillator: Both %K and %D have been in the overbought territory, signaling a potential pullback or correction in the stock price.
Volatility Analysis:
- Bollinger Bands (BB): The stock price has been trading within the upper Bollinger Band, indicating an overbought condition. This could lead to a potential reversal or consolidation in the near term.
Volume Analysis:
- On-Balance Volume (OBV): The OBV has shown a slight increase, indicating buying pressure in the stock. This aligns with the bullish momentum seen in the price action.
- Chaikin Money Flow (CMF): The CMF has been positive, suggesting that money is flowing into the stock. This supports the bullish outlook for the stock.
Key Observations:
- The stock is currently in overbought territory based on RSI and Stochastic indicators.
- The MACD and moving averages suggest a bullish trend in the short term.
- Volatility indicators like Bollinger Bands indicate a potential reversal or consolidation.
- Volume indicators show buying pressure and positive money flow into the stock.
Conclusion:
Based on the analysis of the technical indicators, the stock is likely to experience a short-term consolidation or pullback in the coming days due to overbought conditions indicated by the RSI and Stochastic oscillators. However, the overall trend remains bullish as per the moving averages and MACD. Investors should exercise caution and consider potential profit-taking opportunities in the near future.