Technical Analysis of EWA 2024-05-10
Overview:
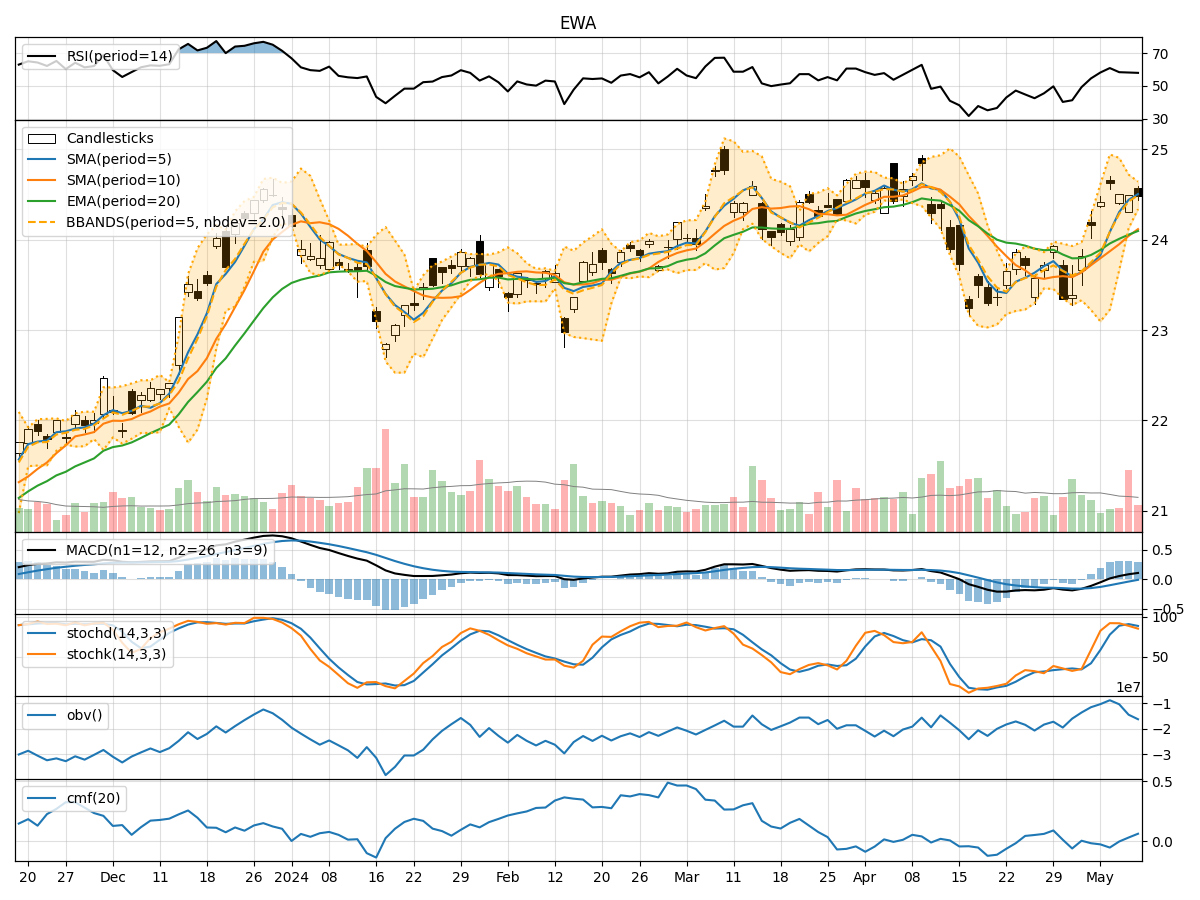
In analyzing the technical indicators for EWA stock over the last 5 days, we will delve into the trend, momentum, volatility, and volume indicators to provide a comprehensive outlook on the possible stock price movement in the coming days.
Trend Analysis:
- Moving Averages (MA): The 5-day Moving Average (MA) has been consistently rising, indicating a bullish trend in the short term.
- MACD: The MACD line has been above the signal line for the past 5 days, suggesting a bullish momentum.
- EMA: The Exponential Moving Average has also been trending upwards, supporting the bullish sentiment.
Momentum Analysis:
- RSI: The Relative Strength Index (RSI) has been hovering around the 50 level, indicating a neutral momentum.
- Stochastic Oscillator: Both %K and %D have been gradually decreasing, signaling a potential reversal in momentum.
- Williams %R: The Williams %R is in oversold territory, suggesting a possible upcoming bullish reversal.
Volatility Analysis:
- Bollinger Bands: The Bollinger Bands have been narrowing, indicating decreasing volatility and a potential breakout in the near future.
- Bollinger %B: The %B indicator is currently below 1, suggesting the stock is trading below the lower Bollinger Band, potentially indicating an oversold condition.
Volume Analysis:
- On-Balance Volume (OBV): The OBV has been fluctuating, indicating indecision among investors regarding the stock.
- Chaikin Money Flow (CMF): The CMF has been negative, suggesting that money may be flowing out of the stock.
Key Observations:
- The trend indicators suggest a bullish sentiment in the short term.
- Momentum indicators show a mixed signal with a potential for a bullish reversal.
- Volatility is decreasing, indicating a possible consolidation phase before a breakout.
- Volume indicators reflect indecision among investors.
Conclusion:
Based on the analysis of the technical indicators, the next few days for EWA stock could see sideways consolidation with a potential bullish reversal in momentum. Traders should closely monitor the narrowing Bollinger Bands for a breakout signal and watch for a confirmation of bullish momentum from the Stochastic Oscillator and Williams %R. It is advisable to wait for a clear direction in volume indicators such as OBV and CMF before making significant trading decisions.