Technical Analysis of EWC 2024-05-10
Overview:
In analyzing the technical indicators for EWC over the last 5 days, we will delve into the trend, momentum, volatility, and volume indicators to provide a comprehensive assessment of the stock's potential price movement. By examining these key factors, we aim to offer valuable insights and predictions for the next few days.
Trend Analysis:
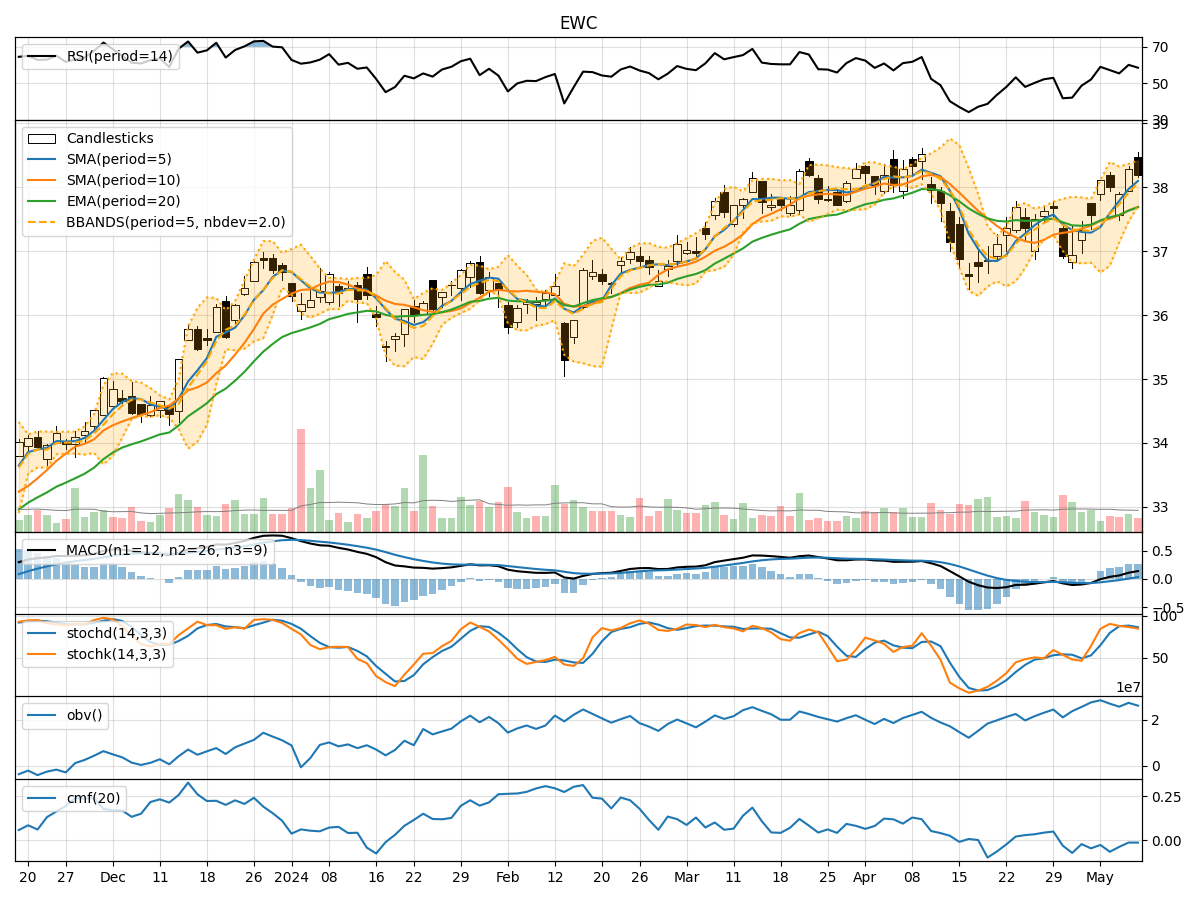
- Moving Averages (MA): The 5-day MA has been consistently above the closing prices, indicating a short-term uptrend.
- MACD: The MACD line has been positive and increasing, suggesting bullish momentum.
- RSI: The RSI has been fluctuating around the overbought territory, indicating strong buying pressure.
Key Observation: The trend indicators point towards a bullish sentiment in the short term.
Momentum Analysis:
- Stochastic Oscillator: Both %K and %D have been relatively high, signaling potential overbought conditions.
- Williams %R: The indicator has been hovering in the oversold region, suggesting a possible reversal.
Key Observation: Momentum indicators show a mixed signal, with stochastic indicating overbought conditions and Williams %R hinting at a potential reversal.
Volatility Analysis:
- Bollinger Bands (BB): The bands have been narrowing, indicating decreasing volatility.
- BB %B: The %B indicator has been fluctuating within a moderate range, suggesting stability.
Key Observation: Volatility indicators suggest a sideways movement with decreasing volatility.
Volume Analysis:
- On-Balance Volume (OBV): The OBV has been fluctuating, indicating indecision among market participants.
- Chaikin Money Flow (CMF): The CMF has been negative, suggesting outflow of money from the stock.
Key Observation: Volume indicators reflect uncertainty in market sentiment.
Conclusion:
Based on the analysis of the technical indicators, the next few days for EWC could see a sideways movement with a slight bullish bias. The trend indicators support a bullish sentiment, while momentum indicators show mixed signals. Volatility is expected to decrease, indicating a potential consolidation phase. Volume indicators suggest uncertainty among investors.
Overall, the stock is likely to experience a period of consolidation with a slight upward bias, but caution is advised due to mixed signals from momentum indicators and negative volume indicators.