Technical Analysis of EWH 2024-05-10
Overview:
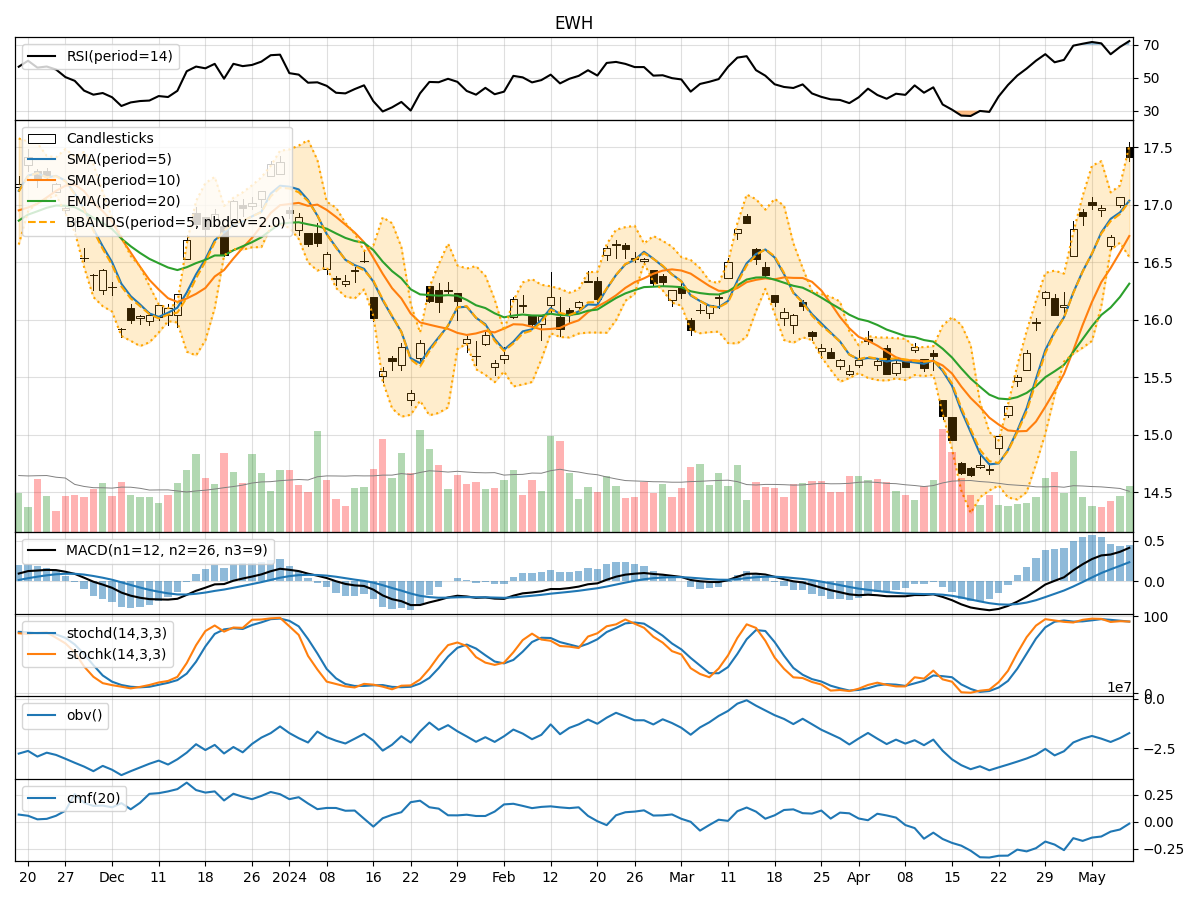
In analyzing the technical indicators for EWH over the last 5 days, we will delve into the trend, momentum, volatility, and volume indicators to provide a comprehensive outlook on the possible stock price movement in the coming days. By examining these key indicators, we aim to offer valuable insights and predictions for potential investors.
Trend Indicators:
- Moving Averages (MA): The 5-day Moving Average (MA) has been consistently rising, indicating a bullish trend in the short term.
- MACD: The MACD line has been increasing, suggesting a strengthening bullish momentum.
- EMA: The Exponential Moving Average (EMA) has been on an upward trajectory, supporting the bullish sentiment.
Momentum Indicators:
- RSI: The Relative Strength Index (RSI) has been fluctuating in the overbought territory, indicating a strong bullish momentum.
- Stochastic Oscillator: Both %K and %D have been relatively high, signaling a bullish momentum.
- Williams %R: The indicator has been hovering in the oversold region, suggesting a potential reversal to the upside.
Volatility Indicators:
- Bollinger Bands (BB): The bands have been widening, indicating increased volatility in the stock price.
- BB %B: The %B value has been fluctuating, reflecting the volatility in the price movements.
Volume Indicators:
- On-Balance Volume (OBV): The OBV has shown mixed signals, indicating some divergence in volume and price movements.
- Chaikin Money Flow (CMF): The CMF has been negative, suggesting a bearish pressure on the stock.
Key Observations:
- The trend indicators suggest a strong bullish sentiment in the short term.
- Momentum indicators point towards a continuation of the bullish momentum.
- Volatility indicators indicate increased price fluctuations, potentially leading to both upside and downside movements.
- Volume indicators show mixed signals, with OBV diverging from price movements and CMF reflecting bearish pressure.
Conclusion:
Based on the analysis of the technical indicators, the next few days' possible stock price movement for EWH is likely to be bullish. The trend is positive, momentum is strong, and volatility may provide trading opportunities. However, investors should closely monitor volume dynamics to confirm the sustainability of the bullish trend. Overall, the outlook for EWH appears upward in the near term.