Technical Analysis of EWI 2024-05-10
Overview:
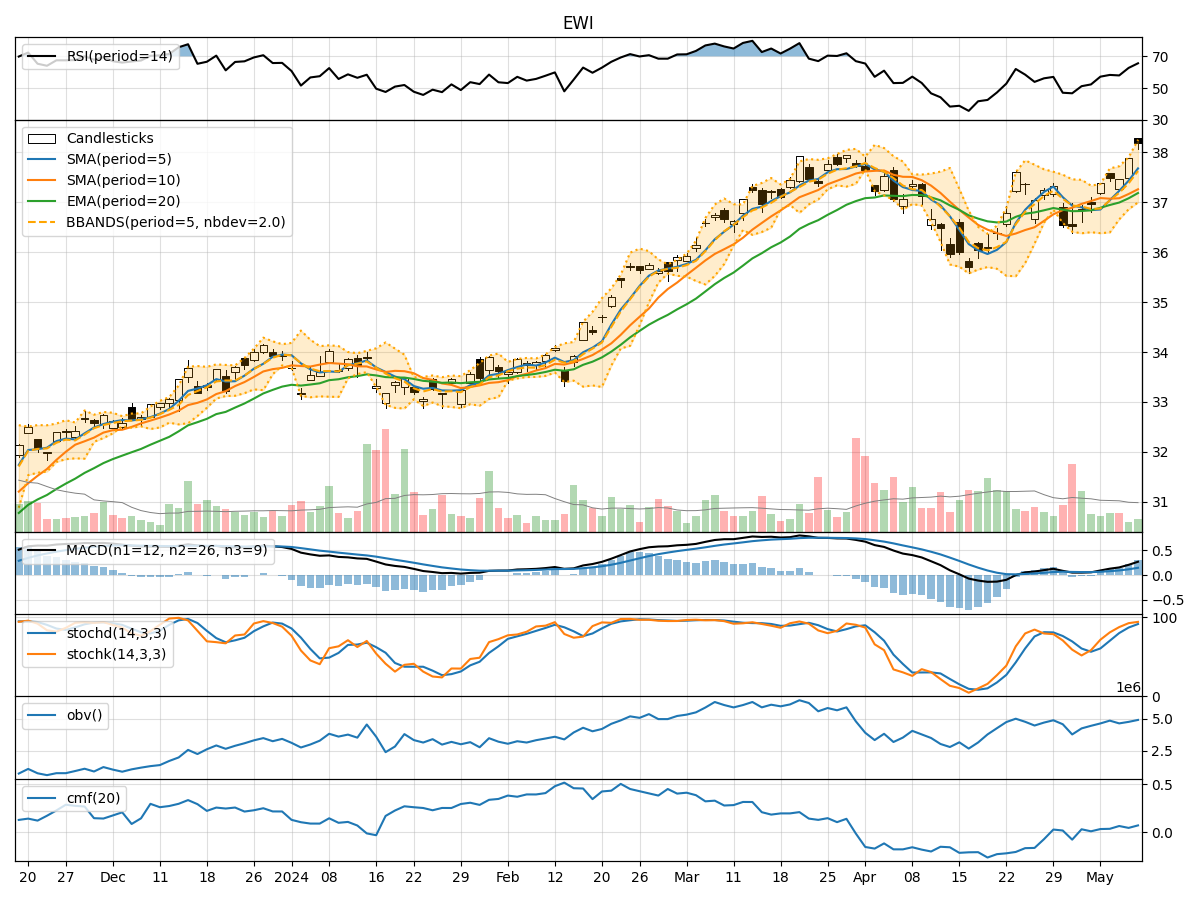
In analyzing the technical indicators for EWI stock over the last 5 days, we will delve into the trend, momentum, volatility, and volume indicators to provide a comprehensive outlook on the possible stock price movement in the coming days.
Trend Analysis:
- Moving Averages (MA): The 5-day Moving Average (MA) has been consistently rising, indicating a bullish trend.
- MACD: The MACD line has been above the signal line, suggesting a positive momentum in the stock price.
Momentum Analysis:
- RSI: The Relative Strength Index (RSI) has been increasing, showing strengthening momentum.
- Stochastic Oscillator: Both %K and %D have been in the overbought zone, indicating a potential reversal or consolidation.
Volatility Analysis:
- Bollinger Bands (BB): The stock price has been trading near the upper Bollinger Band, signifying high volatility.
Volume Analysis:
- On-Balance Volume (OBV): The OBV has been increasing, indicating accumulation by investors.
- Chaikin Money Flow (CMF): The CMF has been positive, suggesting buying pressure in the stock.
Key Observations:
- The stock is in an upward trend based on moving averages and MACD.
- Momentum indicators like RSI show bullish momentum.
- The stock is currently experiencing high volatility as per Bollinger Bands.
- Volume indicators suggest accumulation and buying pressure.
Conclusion:
Based on the analysis of technical indicators, the next few days' possible stock price movement for EWI is likely to be upward. The bullish trend, positive momentum, and buying pressure indicated by the volume indicators support this view. However, caution should be exercised as the stochastic oscillator is in the overbought zone, suggesting a potential reversal or consolidation in the short term. Investors should monitor the stock closely for any signs of a trend reversal.