Technical Analysis of EWJV 2024-05-10
Overview:
In analyzing the technical indicators for EWJV stock over the last 5 days, we will delve into the trend, momentum, volatility, and volume indicators to provide a comprehensive outlook on the possible stock price movement in the coming days. By examining these key indicators, we aim to offer valuable insights and predictions to guide your investment decisions.
Trend Analysis:
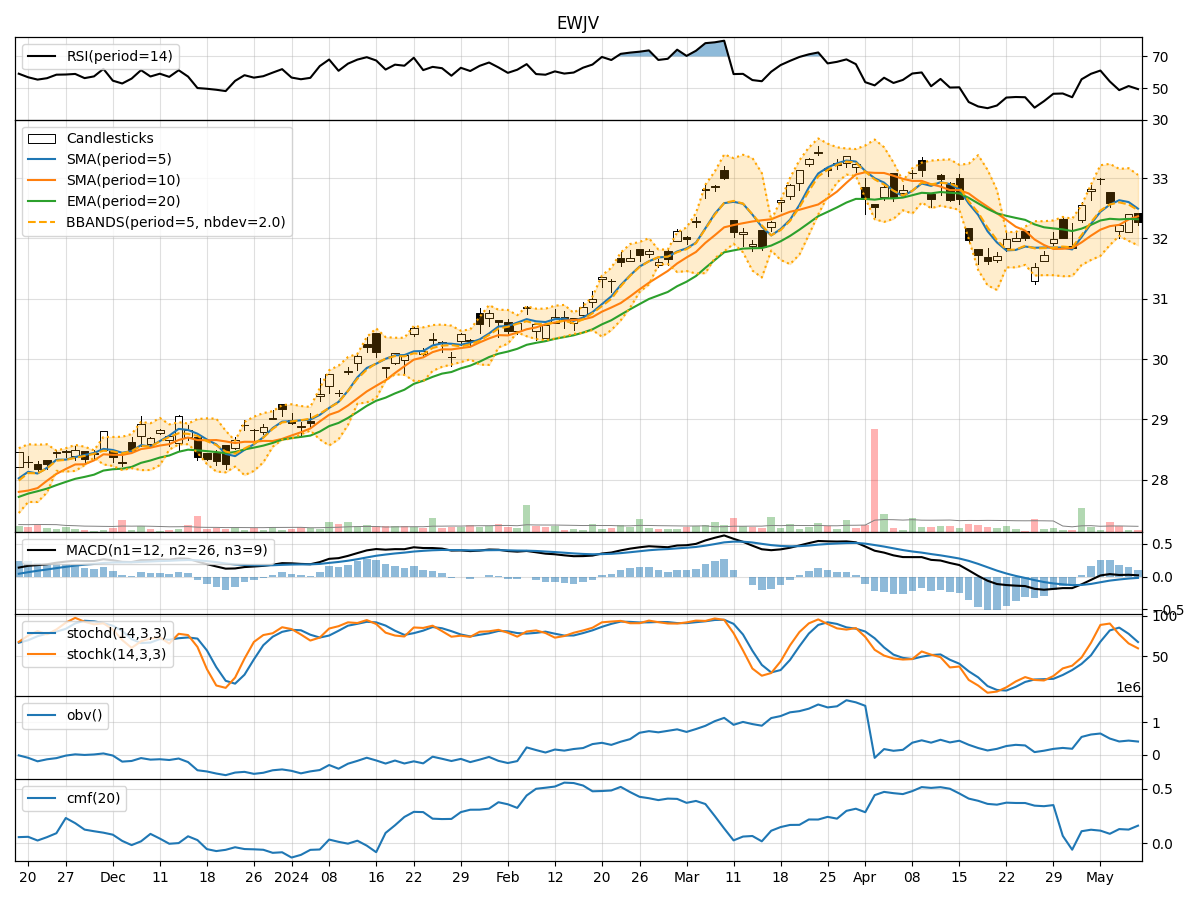
- Moving Averages (MA): The 5-day Moving Average (MA) has been fluctuating around the closing prices, indicating a relatively stable trend.
- MACD: The Moving Average Convergence Divergence (MACD) has shown positive values, suggesting a bullish momentum in the short term.
- EMA: The Exponential Moving Average (EMA) has been slightly increasing, reflecting a positive trend.
Momentum Analysis:
- RSI: The Relative Strength Index (RSI) has been oscillating around the 50 level, indicating a neutral momentum.
- Stochastic Oscillator: Both %K and %D values have been declining, signaling a potential bearish momentum.
- Williams %R: The Williams %R indicator has been hovering in the oversold territory, suggesting a possible reversal.
Volatility Analysis:
- Bollinger Bands: The Bollinger Bands have been narrowing, indicating decreasing volatility in the stock price.
- Bollinger %B: The %B value has been relatively low, suggesting a potential buying opportunity.
- Average True Range (ATR): The ATR has been decreasing, indicating a decline in price volatility.
Volume Analysis:
- On-Balance Volume (OBV): The OBV has shown mixed movements, reflecting indecision among market participants.
- Chaikin Money Flow (CMF): The CMF has been positive, indicating buying pressure in the stock.
Conclusion:
Based on the analysis of the technical indicators, the stock of EWJV is likely to experience sideways consolidation in the coming days. The trend indicators suggest a neutral to slightly bullish outlook, supported by the positive MACD and EMA values. However, the momentum indicators point towards a potential bearish momentum, as indicated by the declining Stochastic %K and %D values. The volatility indicators signal decreasing volatility, which aligns with the expected consolidation phase. The volume indicators show mixed signals, reflecting uncertainty in market sentiment.
In conclusion, while the trend indicators lean towards a positive outlook, the momentum indicators raise concerns about a possible bearish reversal. Therefore, investors should exercise caution and closely monitor key support and resistance levels to make informed trading decisions.