Technical Analysis of EWK 2024-05-10
Overview:
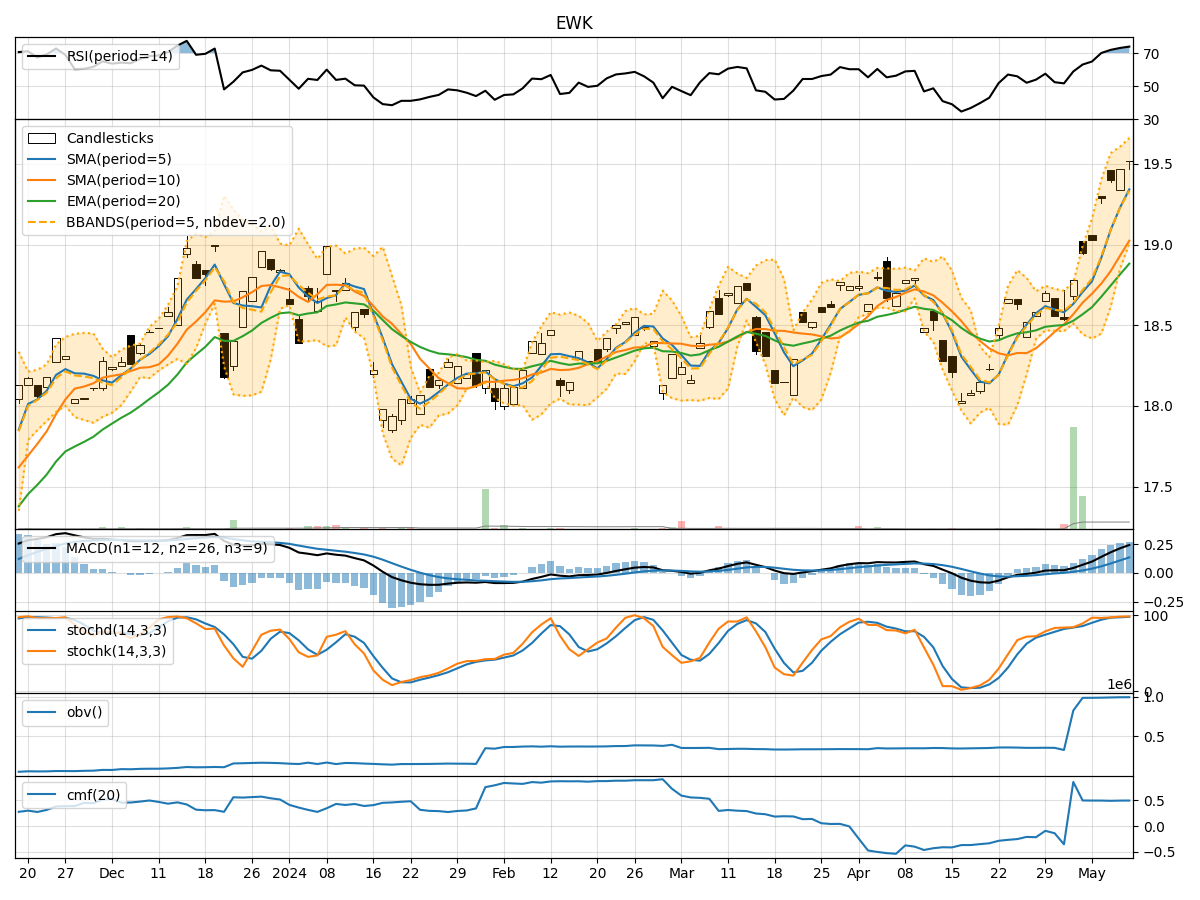
In the last 5 trading days, the stock price of EWK has shown a consistent uptrend with increasing closing prices. Various technical indicators across trend, momentum, volatility, and volume categories have been analyzed to provide insights into the possible future stock price movement.
Trend Analysis:
- Moving Averages (MA): The moving averages (MA) indicate a bullish trend as the closing prices are consistently above the short-term (5-day) and medium-term (10-day) moving averages.
- MACD: The MACD line is above the signal line, indicating a bullish momentum in the stock price.
- RSI: The Relative Strength Index (RSI) is in the overbought territory, suggesting a strong bullish momentum.
Key Observation: The trend indicators suggest a strong bullish trend in the stock price of EWK.
Momentum Analysis:
- Stochastic Oscillator: Both %K and %D lines are in the overbought zone, indicating a potential reversal or consolidation.
- Williams %R: The Williams %R is also in the oversold territory, signaling a potential reversal.
Key Observation: The momentum indicators suggest a possible short-term reversal or consolidation in the stock price.
Volatility Analysis:
- Bollinger Bands (BB): The stock price is currently trading near the upper Bollinger Band, indicating a high level of volatility.
- Bollinger Band Width: The Bollinger Band Width is narrowing, suggesting a potential decrease in volatility.
Key Observation: The volatility indicators suggest a possible decrease in volatility and a potential consolidation phase.
Volume Analysis:
- On-Balance Volume (OBV): The OBV has been steadily increasing, indicating strong buying pressure in the stock.
- Chaikin Money Flow (CMF): The CMF is positive, indicating that money is flowing into the stock.
Key Observation: The volume indicators suggest strong buying interest and positive money flow into the stock.
Conclusion:
Based on the analysis of technical indicators, the stock price of EWK is likely to experience a short-term consolidation or reversal in the upcoming trading days. The strong bullish trend may pause temporarily due to overbought conditions in momentum indicators and high volatility levels. However, the overall outlook remains bullish in the medium to long term, supported by positive volume indicators and a strong uptrend.
Recommendation: Traders may consider taking profits or tightening stop-loss levels in the short term, while long-term investors can hold their positions with a bullish bias. Monitoring key support and resistance levels along with potential reversal patterns will be crucial in navigating the upcoming price movements.