Technical Analysis of EWL 2024-05-10
Overview:
In analyzing the technical indicators for EWL over the last 5 days, we will delve into the trend, momentum, volatility, and volume indicators to provide a comprehensive outlook on the possible stock price movement in the coming days. By examining these key indicators, we aim to offer valuable insights and predictions for potential investors.
Trend Indicators:
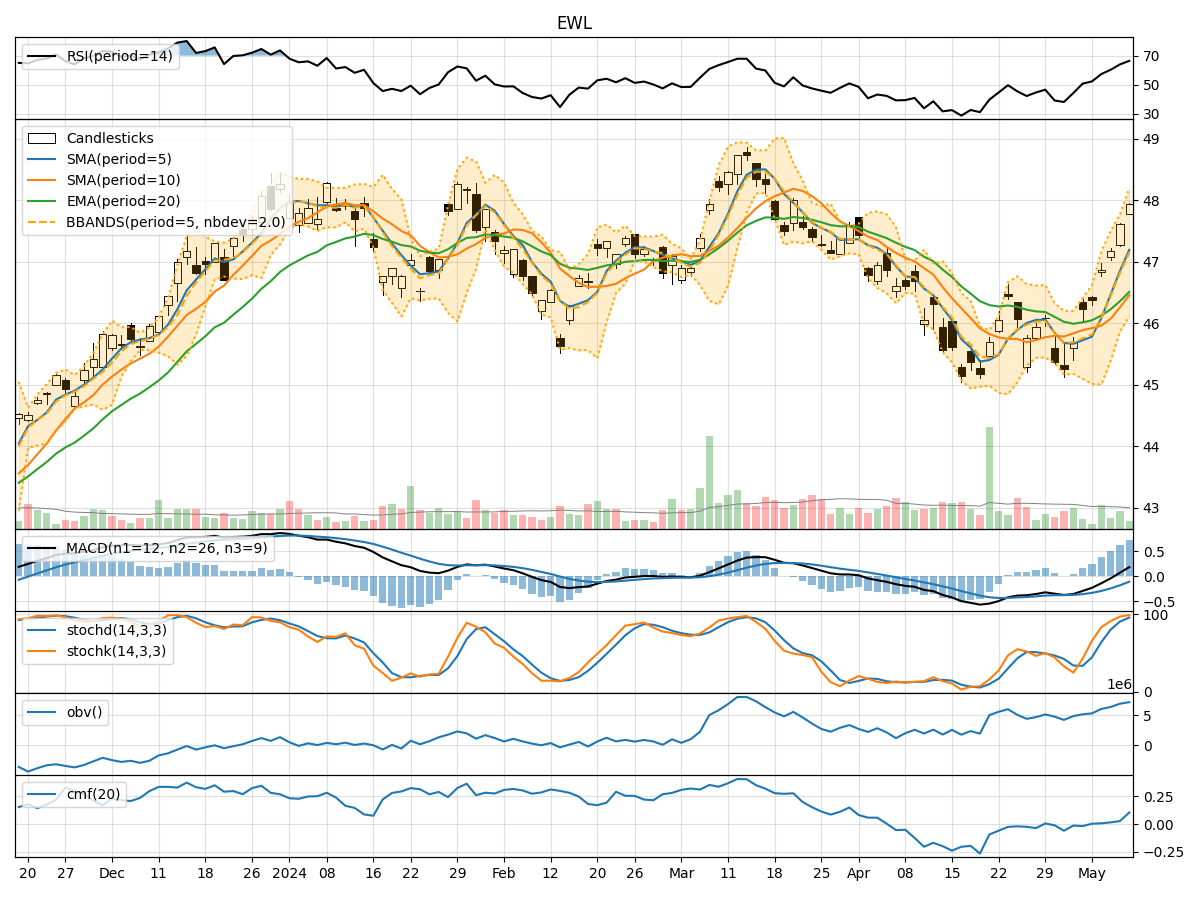
- Moving Averages (MA): The 5-day moving average has been consistently rising, indicating a bullish trend in the short term.
- MACD: The MACD line has been increasing, crossing above the signal line, suggesting a bullish momentum.
- Relative Strength Index (RSI): The RSI has been trending upwards, indicating increasing buying pressure.
Momentum Indicators:
- Stochastic Oscillator: Both %K and %D lines are in the overbought zone, suggesting a potential reversal or consolidation.
- Williams %R (WillR): The indicator is in the oversold territory, signaling a possible buying opportunity.
Volatility Indicators:
- Bollinger Bands (BB): The stock price has been trading within the bands, indicating normal volatility.
- Bollinger %B (BBP): The %B is fluctuating around the midline, suggesting a balanced market sentiment.
Volume Indicators:
- On-Balance Volume (OBV): The OBV has been steadily increasing, indicating accumulation by investors.
- Chaikin Money Flow (CMF): The CMF is positive, reflecting buying pressure in the stock.
Key Observations:
- The trend indicators suggest a bullish sentiment in the short term.
- Momentum indicators show conflicting signals with stochastic in overbought territory and Williams %R in oversold territory.
- Volatility indicators indicate normal price fluctuations within the Bollinger Bands.
- Volume indicators point towards increasing buying interest in the stock.
Conclusion:
Based on the analysis of the technical indicators, the next few days' possible stock price movement for EWL is likely to be upward with a bullish bias. Investors should consider entering long positions or holding onto existing positions to capitalize on the expected price appreciation. However, it is essential to monitor the stochastic oscillator for a potential reversal and adjust trading strategies accordingly.