Technical Analysis of EWN 2024-05-10
Overview:
In analyzing the technical indicators for EWN stock over the last 5 days, we will delve into the trend, momentum, volatility, and volume indicators to provide a comprehensive assessment of the stock's potential price movement. By examining these key factors, we aim to offer valuable insights and predictions for the next few days.
Trend Analysis:
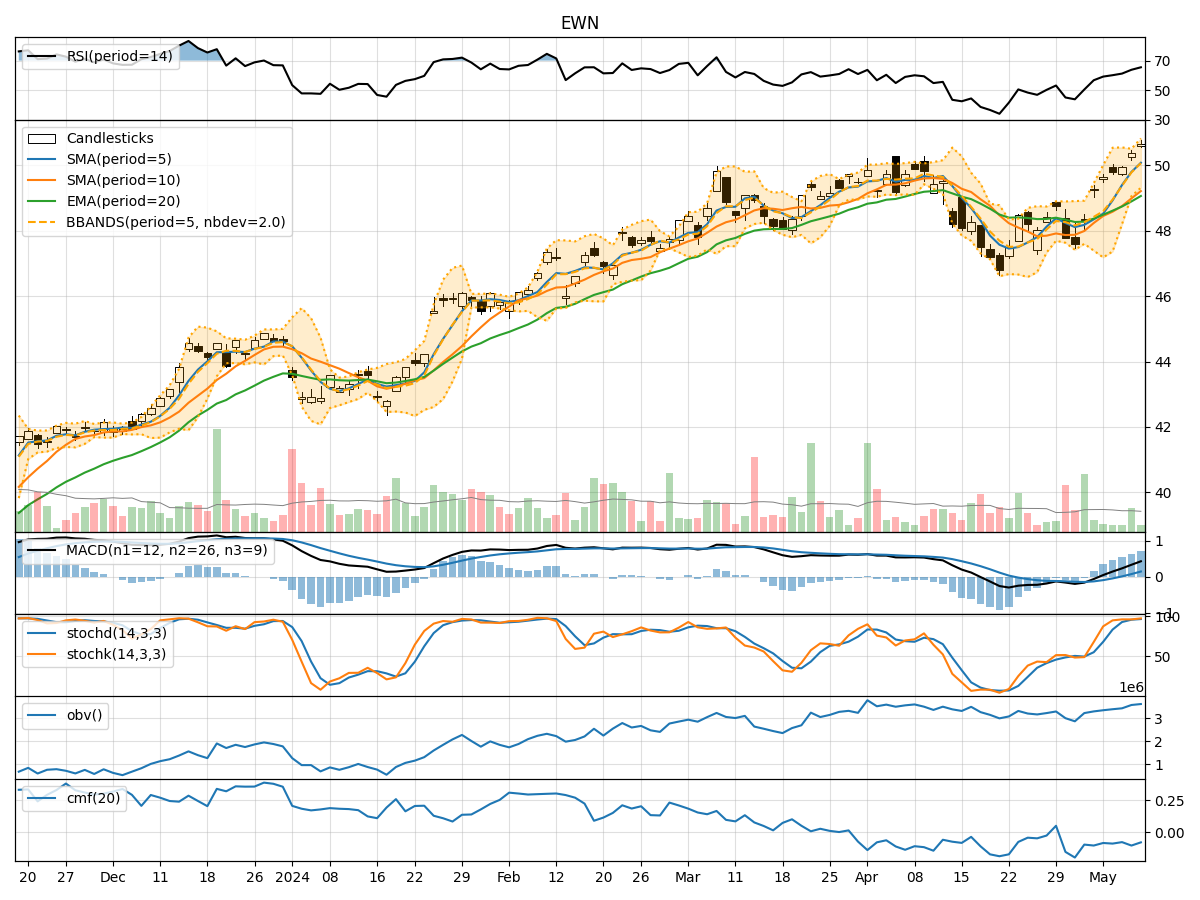
- Moving Averages (MA): The 5-day Moving Average (MA) has been consistently rising, indicating a bullish trend in the short term.
- MACD: The MACD line has been increasing, crossing above the signal line, suggesting a bullish momentum.
- RSI: The Relative Strength Index (RSI) is in the overbought territory, indicating a strong bullish momentum.
Key Observation: The trend indicators suggest a strong bullish sentiment in the stock price.
Momentum Analysis:
- Stochastic Oscillator: Both %K and %D lines are in the overbought zone, signaling a potential reversal or consolidation.
- Williams %R: The Williams %R is also in the overbought region, indicating a possible pullback.
Key Observation: Momentum indicators are showing signs of potential overbought conditions, hinting at a short-term correction or consolidation.
Volatility Analysis:
- Bollinger Bands (BB): The stock price has been trading near the upper Bollinger Band, indicating high volatility and a potential overbought condition.
Key Observation: Volatility indicators suggest a heightened level of price fluctuation, potentially leading to a reversal or correction.
Volume Analysis:
- On-Balance Volume (OBV): The OBV has been increasing, indicating accumulation by investors.
- Chaikin Money Flow (CMF): The CMF is negative, suggesting a bearish money flow trend.
Key Observation: Volume indicators show conflicting signals, with OBV indicating accumulation while CMF suggests a bearish money flow.
Conclusion:
Based on the analysis of the technical indicators, the stock is currently in an overbought state with strong bullish momentum. However, the momentum and volatility indicators are signaling a potential reversal or consolidation in the short term. The conflicting signals from volume indicators add to the uncertainty.
Recommendation:
Considering the overbought conditions and potential reversal signals from momentum and volatility indicators, it is advisable to exercise caution. Traders may consider taking profits or implementing risk management strategies. Long-term investors could wait for a better entry point during a potential pullback.
Disclaimer:
This analysis is based solely on technical indicators and historical data. Market conditions can change rapidly, and unforeseen events may impact stock prices. It is essential to conduct thorough research and consider other factors before making investment decisions. Consulting with a financial advisor is recommended for personalized guidance tailored to individual investment goals and risk tolerance.