Technical Analysis of EWO 2024-05-10
Overview:
In analyzing the technical indicators for EWO over the last 5 days, we will delve into the trend, momentum, volatility, and volume indicators to provide a comprehensive outlook on the possible stock price movement in the coming days. By examining these key aspects, we aim to offer valuable insights and recommendations for potential investors.
Trend Analysis:
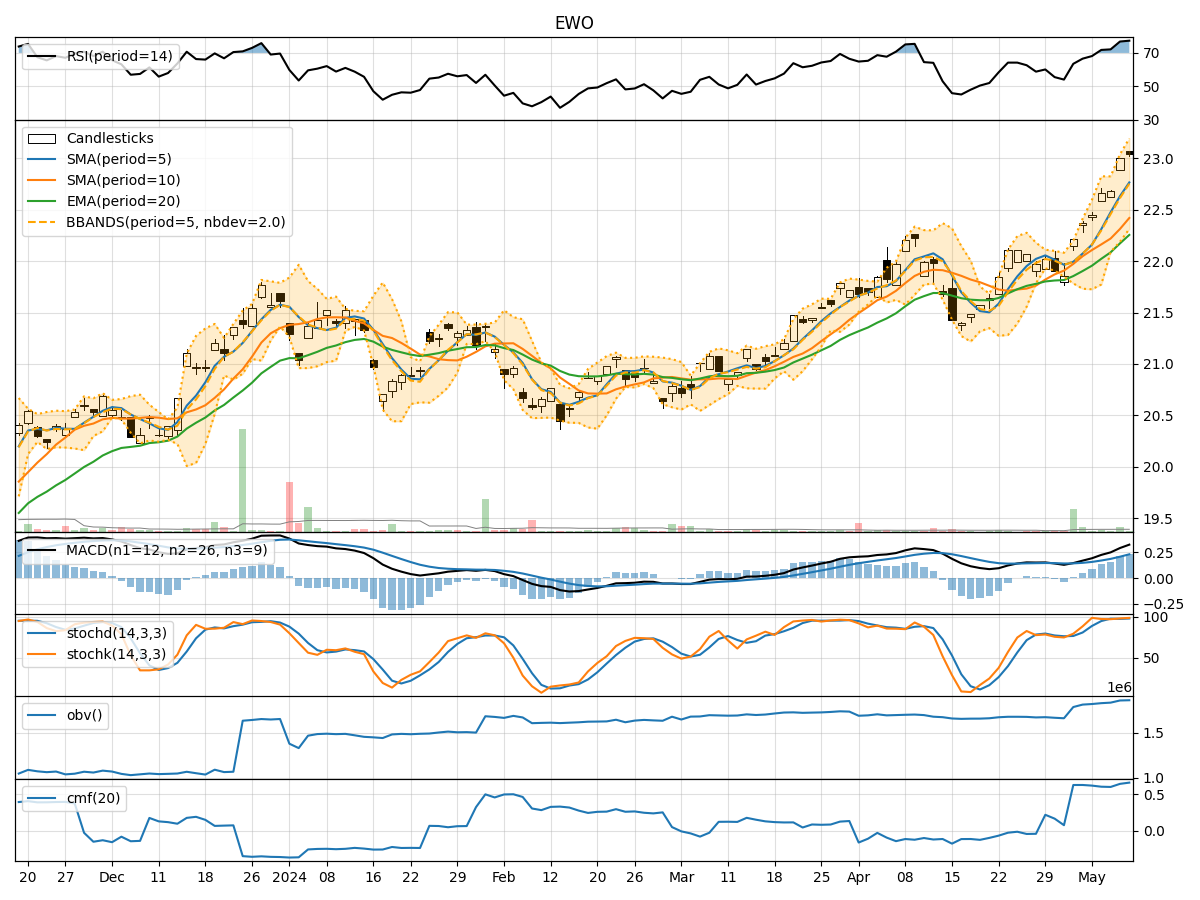
- Moving Averages (MA): The 5-day Moving Average (MA) has been consistently above the Simple Moving Average (SMA) and Exponential Moving Average (EMA), indicating a bullish trend.
- MACD: The MACD line has been consistently above the signal line, with both lines showing an upward trend, suggesting bullish momentum.
Momentum Analysis:
- RSI: The Relative Strength Index (RSI) has been in the overbought territory, indicating a strong bullish momentum.
- Stochastic Oscillator: Both %K and %D have been in the overbought zone, suggesting a potential reversal or consolidation.
Volatility Analysis:
- Bollinger Bands (BB): The stock price has been trading within the upper Bollinger Band, indicating high volatility.
Volume Analysis:
- On-Balance Volume (OBV): The OBV has been steadily increasing, reflecting strong buying pressure.
- Chaikin Money Flow (CMF): The CMF has been positive, indicating a bullish money flow into the stock.
Key Observations:
- The trend indicators suggest a strong bullish sentiment in the short term.
- Momentum indicators show an overbought condition, which might lead to a potential pullback or consolidation.
- Volatility remains high, indicating significant price fluctuations.
- Volume indicators reflect increasing buying pressure, supporting the bullish outlook.
Conclusion:
Based on the analysis of the technical indicators, the next few days' possible stock price movement for EWO is likely to continue in an upward direction. However, considering the overbought conditions in the momentum indicators, there might be a short-term consolidation or pullback before the uptrend resumes. Investors should closely monitor the price action and key support levels for potential entry or exit points.
Recommendation:
- Short-term Traders: Consider taking profits or tightening stop-loss levels to protect gains during a potential consolidation phase.
- Long-term Investors: Hold positions with a bullish bias, but remain vigilant for any signs of trend reversal or extended consolidation.
By combining the insights from trend, momentum, volatility, and volume indicators, investors can make informed decisions aligned with the current market dynamics and technical signals.