Technical Analysis of EWP 2024-05-10
Overview:
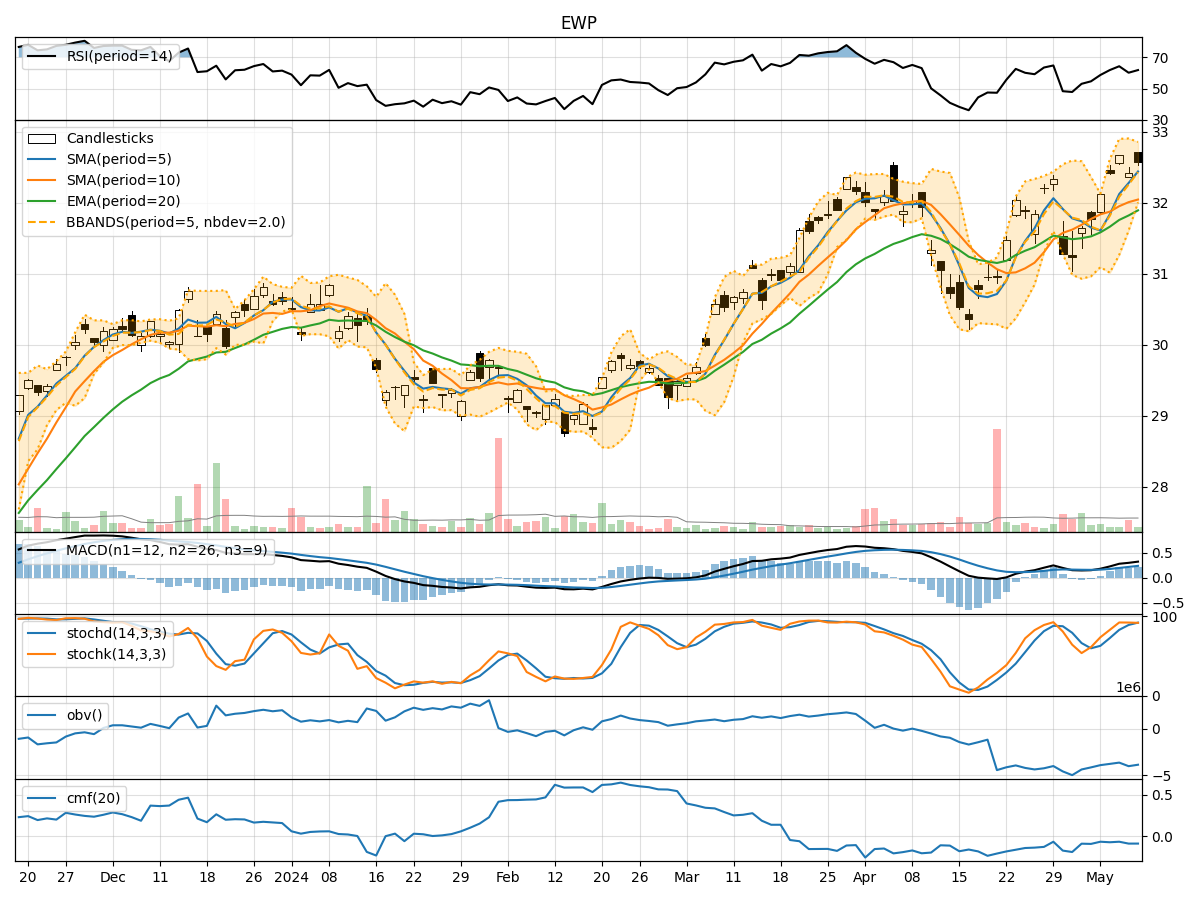
In analyzing the technical indicators for the last 5 days of EWP stock, we will delve into the trend, momentum, volatility, and volume indicators to provide a comprehensive outlook on the possible stock price movement in the coming days. By examining these key indicators, we aim to offer valuable insights and predictions for potential investors.
Trend Indicators:
- Moving Averages (MA): The 5-day MA has been consistently above the 10-day SMA, indicating a short-term bullish trend. The EMA(20) has been steadily increasing, reflecting positive momentum.
- MACD: The MACD line has been above the signal line for the past 5 days, suggesting bullish momentum in the stock price.
- Conclusion: The trend indicators point towards an upward trend in the stock price.
Momentum Indicators:
- RSI: The RSI has been fluctuating around the 60-65 range, indicating moderate momentum without being overbought or oversold.
- Stochastic Oscillator: Both %K and %D have been consistently high, suggesting strong buying pressure.
- Conclusion: Momentum indicators signal a bullish sentiment in the stock.
Volatility Indicators:
- Bollinger Bands (BB): The stock price has been trading within the bands, with the %B indicator hovering around 0.6-0.8, indicating moderate volatility.
- Conclusion: Volatility indicators suggest a stable price movement with no extreme fluctuations.
Volume Indicators:
- On-Balance Volume (OBV): The OBV has been declining over the past 5 days, indicating a decrease in buying volume.
- Chaikin Money Flow (CMF): The CMF has been negative, reflecting a lack of buying pressure.
- Conclusion: Volume indicators point towards a decreasing buying interest in the stock.
Overall Conclusion:
Based on the analysis of trend, momentum, volatility, and volume indicators, the EWP stock is likely to experience a short-term upward trend with bullish momentum in the coming days. However, the decreasing buying volume raises some concerns about the sustainability of this trend. Investors should closely monitor the price action and volume dynamics to confirm the continuation of the upward movement. It is advisable to exercise caution and consider potential profit-taking opportunities as the stock approaches key resistance levels.