Technical Analysis of EWS 2024-05-10
Overview:
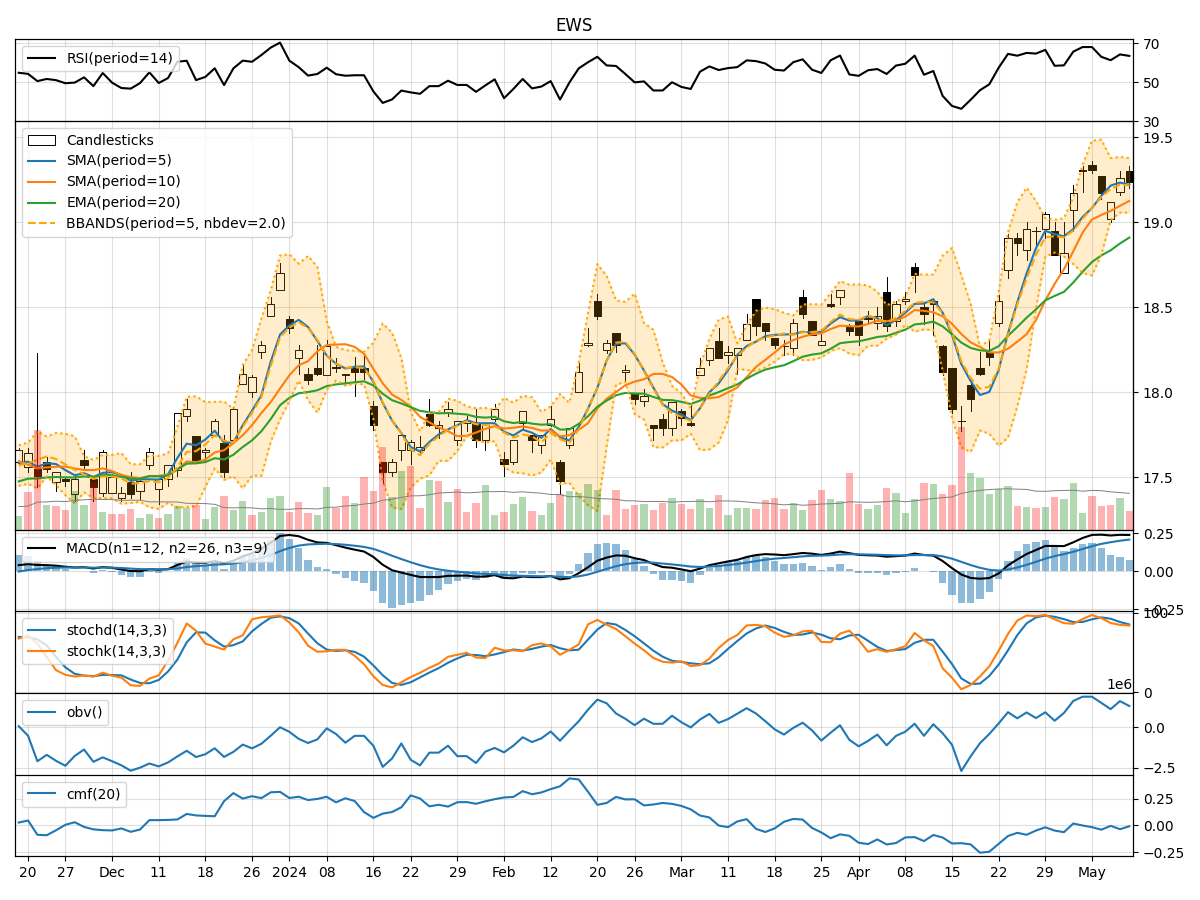
In analyzing the technical indicators for EWS over the last 5 days, we will delve into the trend, momentum, volatility, and volume indicators to provide a comprehensive outlook on the possible stock price movement in the coming days. By examining these key factors, we aim to offer valuable insights and predictions to guide investment decisions.
Trend Analysis:
- Moving Averages (MA): The 5-day MA has been consistently above the closing prices, indicating a short-term uptrend.
- MACD: The MACD line has been positive and above the signal line, suggesting bullish momentum.
- RSI: The RSI values have been fluctuating around the overbought territory, indicating potential strength in the current trend.
Momentum Analysis:
- Stochastic Oscillator: The %K and %D values have been relatively high, signaling potential overbought conditions.
- Williams %R: The Williams %R values have been hovering in the oversold territory, indicating a possible reversal.
Volatility Analysis:
- Bollinger Bands (BB): The stock price has been trading within the bands, suggesting a period of consolidation.
- BB %B: The %B values have been fluctuating around the middle range, indicating a balanced market sentiment.
Volume Analysis:
- On-Balance Volume (OBV): The OBV values have been fluctuating, indicating indecision among market participants.
- Chaikin Money Flow (CMF): The CMF values have been negative, suggesting selling pressure in the market.
Key Observations:
- The trend indicators point towards a bullish sentiment in the short term.
- Momentum indicators show conflicting signals with overbought and oversold conditions.
- Volatility indicators suggest a period of consolidation.
- Volume indicators reflect uncertainty and lack of strong buying or selling pressure.
Conclusion:
Based on the analysis of the technical indicators, the next few days' possible stock price movement for EWS is likely to be sideways with a slight upward bias. The bullish trend indicated by moving averages and MACD may be limited by the overbought conditions highlighted by momentum indicators. The volatility and volume indicators suggest a lack of strong conviction in the market, leading to a probable period of consolidation. Traders should exercise caution and closely monitor key support and resistance levels for potential breakout opportunities.