Technical Analysis of EWT 2024-05-10
Overview:
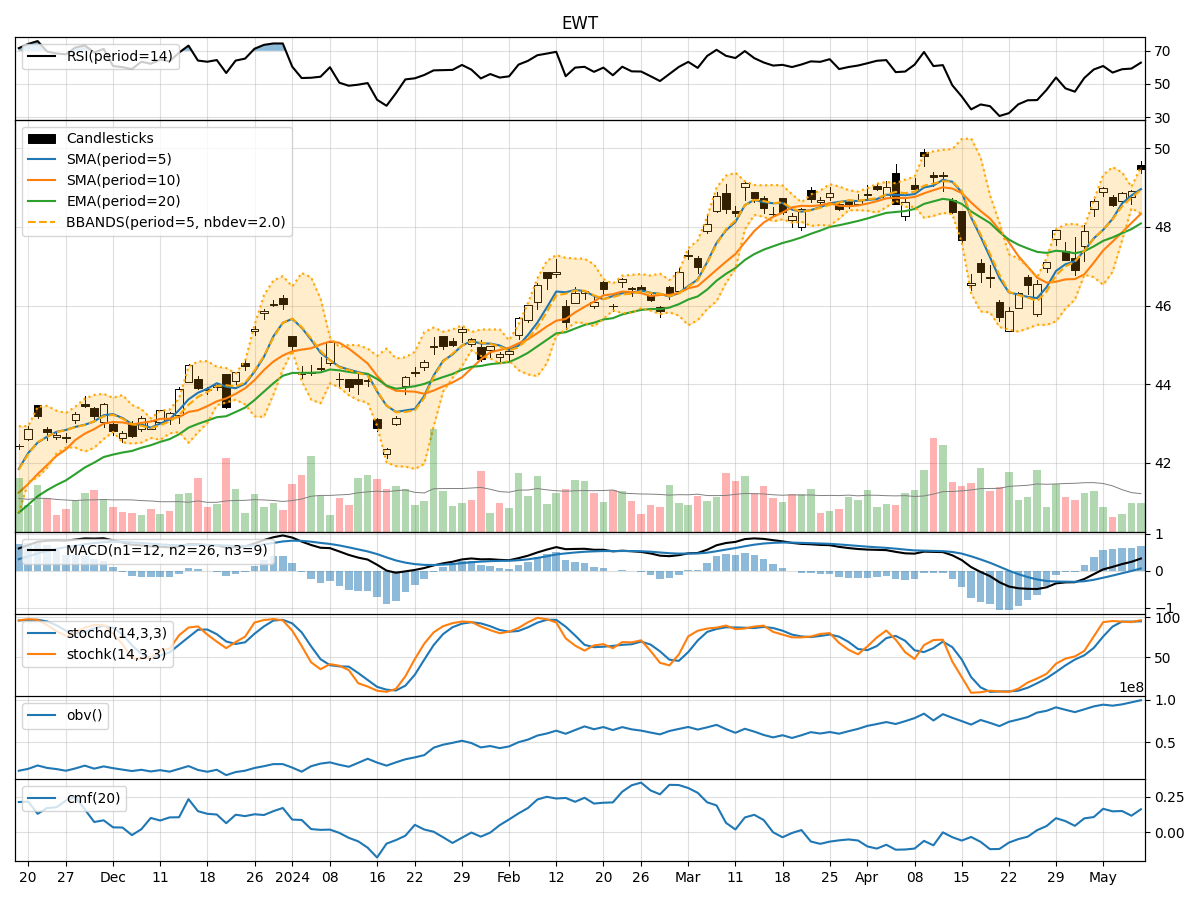
In the last 5 trading days, the stock price of EWT has shown a gradual increase, with the closing price rising from 48.99 to 49.46. Various technical indicators have been analyzed to provide insights into the possible future stock price movement. The analysis covers trend indicators, momentum indicators, volatility indicators, and volume indicators.
Trend Indicators:
- Moving Averages (MA): The 5-day Moving Average has been consistently above the Simple Moving Average (SMA) of 10 days, indicating a short-term bullish trend.
- Exponential Moving Average (EMA): The EMA has been steadily increasing, reflecting a positive trend in the stock price.
- MACD: The MACD line has been above the signal line, suggesting a bullish momentum.
Key Observation: The trend indicators point towards an upward trend in the stock price.
Momentum Indicators:
- Relative Strength Index (RSI): The RSI has been in the range of 50-70, indicating a moderate bullish momentum.
- Stochastic Oscillator: Both %K and %D have been in the overbought zone, suggesting a strong bullish momentum.
- Williams %R (Willams %R): The indicator has been in the oversold zone, indicating a potential reversal.
Key Observation: Momentum indicators suggest a strong bullish sentiment in the stock.
Volatility Indicators:
- Bollinger Bands (BB): The stock price has been trading within the upper Bollinger Band, indicating high volatility.
- Bollinger Band Width (BBW): The BBW has been fluctuating, reflecting changing volatility levels.
- Bollinger Band %B (BBP): The %B has been above 0.5, indicating an uptrend.
Key Observation: Volatility indicators suggest increased volatility in the stock price.
Volume Indicators:
- On-Balance Volume (OBV): The OBV has been increasing, indicating accumulation by investors.
- Chaikin Money Flow (CMF): The CMF has been positive, suggesting buying pressure in the stock.
Key Observation: Volume indicators point towards positive accumulation and buying pressure.
Conclusion:
Based on the analysis of technical indicators, the stock of EWT is likely to experience a continued upward movement in the next few days. The trend indicators, momentum indicators, and volume indicators all suggest a bullish sentiment in the stock. However, the increased volatility indicated by volatility indicators should be noted, as it may lead to short-term fluctuations in the stock price. Overall, the outlook for EWT is bullish in the near term.
Recommendation: Consider holding or adding to positions in EWT for potential further gains in the short to medium term. Keep a close watch on volatility levels and set appropriate stop-loss levels to manage risk effectively.