Technical Analysis of EWUS 2024-05-10
Overview:
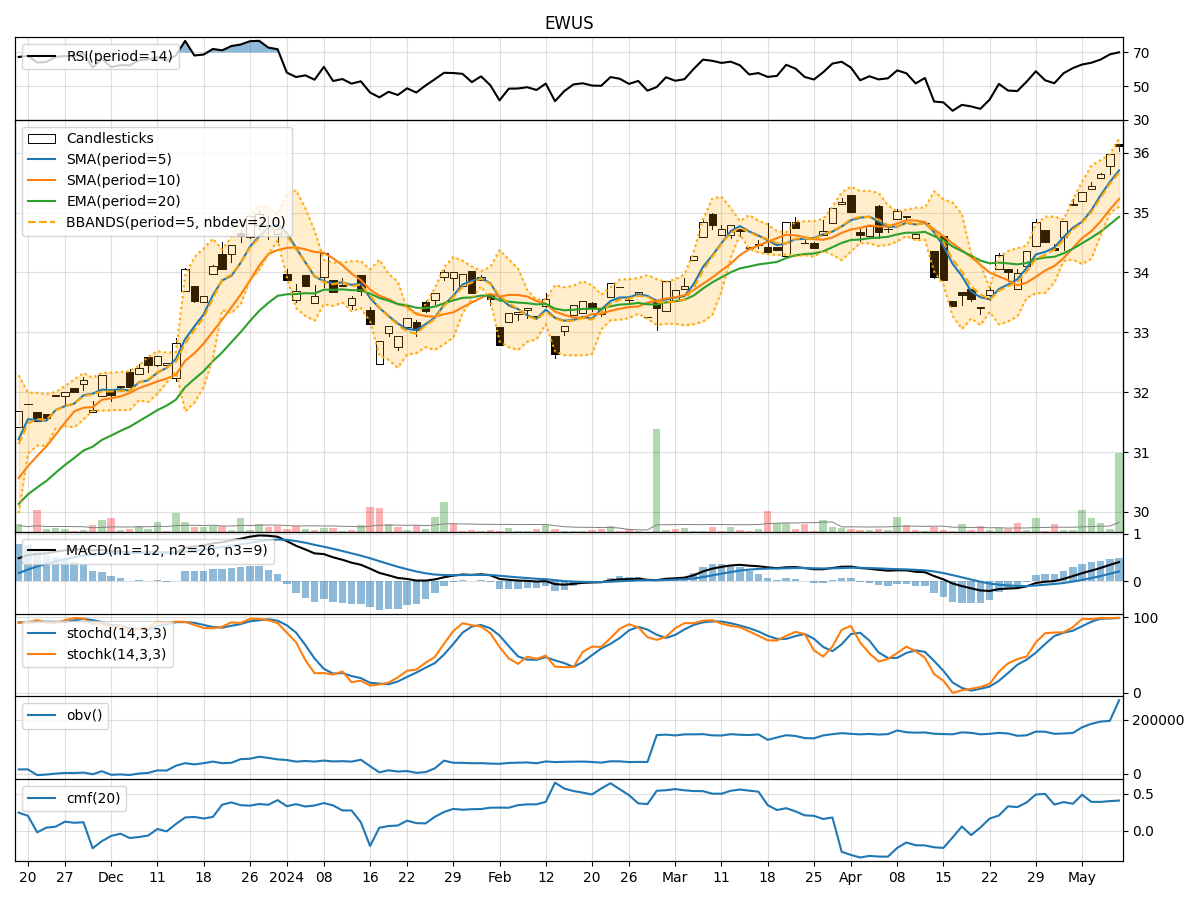
In analyzing the technical indicators for EWUS over the last 5 days, we will delve into the trend, momentum, volatility, and volume indicators to provide a comprehensive outlook on the possible stock price movement in the coming days.
Trend Analysis:
- Moving Averages (MA): The 5-day Moving Average (MA) has been consistently rising, indicating a bullish trend in the short term.
- MACD: The MACD line has been increasing, and the MACD Histogram is also showing positive values, suggesting bullish momentum.
Momentum Analysis:
- RSI: The Relative Strength Index (RSI) has been trending upwards, indicating increasing buying pressure.
- Stochastic Oscillator: Both %K and %D lines of the Stochastic Oscillator are in the overbought zone, signaling a strong bullish momentum.
Volatility Analysis:
- Bollinger Bands (BB): The Bollinger Bands are widening, indicating increased volatility in the stock price.
Volume Analysis:
- On-Balance Volume (OBV): The OBV has been steadily increasing, showing accumulation by investors.
- Chaikin Money Flow (CMF): The CMF is positive, indicating buying pressure in the stock.
Key Observations:
- The stock is in a strong uptrend based on moving averages and MACD.
- Momentum indicators like RSI and Stochastic Oscillator suggest a bullish sentiment.
- Volatility is increasing, which could lead to larger price swings.
- Volume indicators show consistent accumulation by investors.
Conclusion:
Based on the analysis of the technical indicators, the next few days' possible stock price movement for EWUS is likely to be bullish. The uptrend supported by moving averages and MACD, coupled with strong momentum signals from RSI and Stochastic Oscillator, indicates a favorable outlook for the stock. However, traders should be cautious of increased volatility and monitor volume trends for confirmation of the bullish bias.