Technical Analysis of EWV 2024-05-10
Overview:
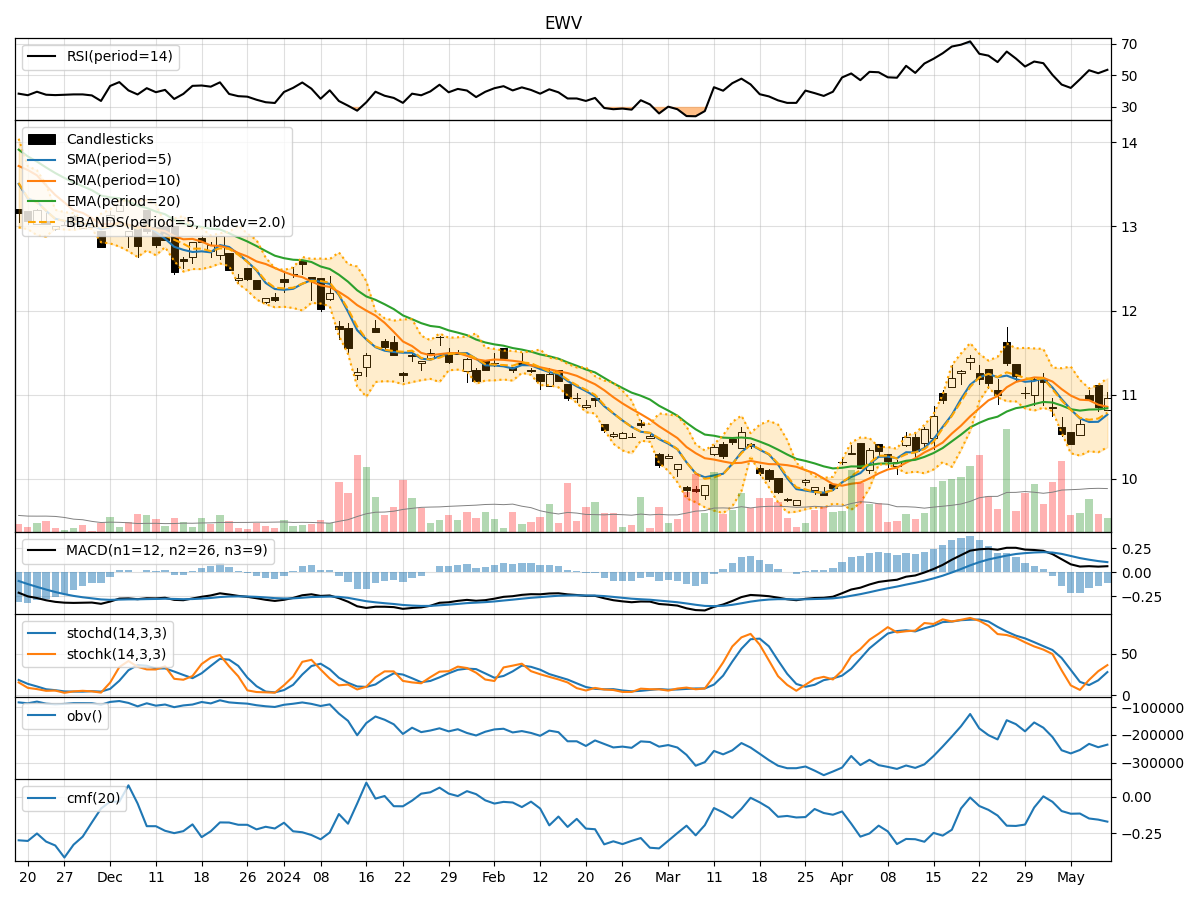
In analyzing the technical indicators for EWV over the last 5 days, we will delve into the trend, momentum, volatility, and volume indicators to provide a comprehensive outlook on the possible stock price movement. By examining these key indicators, we aim to offer valuable insights and predictions for the upcoming trading days.
Trend Indicators:
- Moving Averages (MA): The 5-day Moving Average (MA) has been fluctuating around the closing prices, indicating short-term price trends. The Simple Moving Average (SMA) and Exponential Moving Average (EMA) show a slight downward trend, with the EMA lagging behind.
- MACD: The Moving Average Convergence Divergence (MACD) and its signal line (MACDH) have been negative, suggesting a bearish momentum in the stock price.
Momentum Indicators:
- RSI: The Relative Strength Index (RSI) has been hovering around the mid-range, indicating a neutral momentum in the stock.
- Stochastic Oscillator: Both %K and %D lines of the Stochastic Oscillator are showing an upward trend, suggesting a potential bullish momentum.
Volatility Indicators:
- Bollinger Bands (BB): The Bollinger Bands are widening, indicating increased volatility in the stock price.
Volume Indicators:
- On-Balance Volume (OBV): The OBV has been fluctuating, indicating a balance between buying and selling pressure.
- Chaikin Money Flow (CMF): The CMF has been negative, suggesting a bearish sentiment in the stock.
Key Observations and Opinions:
- Trend: The trend indicators show a mixed signal with a slight bearish bias due to the negative MACD. The moving averages are indicating a potential downward trend.
- Momentum: The momentum indicators are conflicting, with RSI neutral but Stochastic Oscillator showing a bullish momentum.
- Volatility: The widening Bollinger Bands suggest increased volatility, which could lead to significant price movements.
- Volume: The volume indicators reflect a balance between buying and selling pressure, with a slightly bearish sentiment indicated by the CMF.
Conclusion:
Based on the analysis of the technical indicators, the stock price of EWV is likely to experience sideways movement in the next few days. The conflicting signals from momentum indicators and the slightly bearish trend indicators suggest a lack of clear direction. However, the increased volatility indicated by the Bollinger Bands could lead to short-term price fluctuations. Traders should exercise caution and closely monitor key levels for potential entry or exit points.