Technical Analysis of EWX 2024-05-10
Overview:
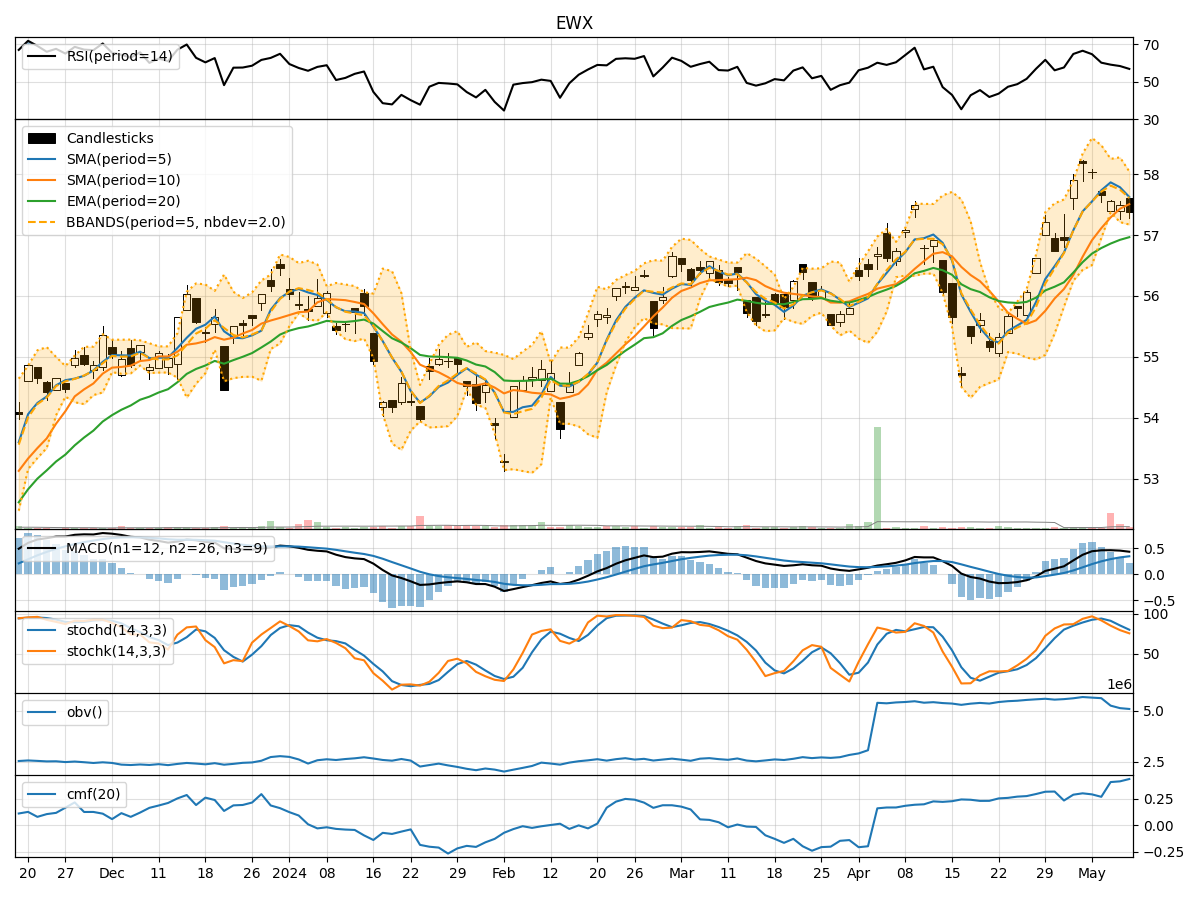
In the last 5 trading days, EWX stock has shown a relatively stable performance with minor fluctuations in price and volume. The trend indicators suggest a slight uptrend, supported by moving averages and MACD. Momentum indicators indicate a weakening bullish momentum, while volatility indicators show a narrowing Bollinger Bands range. Volume indicators reflect a consistent accumulation of volume.
Trend Indicators Analysis:
- Moving averages (MA) are trending slightly upwards, indicating a positive trend.
- MACD is positive, suggesting bullish momentum.
- EMA is also trending upwards, supporting the bullish sentiment.
Momentum Indicators Analysis:
- RSI is declining, indicating a weakening bullish momentum.
- Stochastic oscillators are in overbought territory, suggesting a potential reversal.
- Williams %R is in oversold territory, indicating a possible buying opportunity.
Volatility Indicators Analysis:
- Bollinger Bands are narrowing, indicating decreasing volatility.
- The narrowing range suggests a potential breakout or breakdown in the near future.
Volume Indicators Analysis:
- On-Balance Volume (OBV) is steadily increasing, indicating accumulation.
- Chaikin Money Flow (CMF) is positive, reflecting buying pressure.
Key Observations:
- The stock is in a slight uptrend based on trend indicators.
- Momentum is weakening, indicating a possible reversal or consolidation.
- Volatility is decreasing, suggesting a potential price breakout.
- Volume is steadily increasing, supporting the bullish bias.
Conclusion:
Based on the analysis of technical indicators, the next few days' possible stock price movement for EWX is likely to be bullish. The uptrend indicated by moving averages and MACD, coupled with the accumulation of volume, suggests a positive outlook. However, caution is advised due to the weakening momentum and potential for a price breakout indicated by narrowing Bollinger Bands. Traders should monitor the stock closely for any signs of a reversal or consolidation.