Technical Analysis of EWY 2024-05-10
Overview:
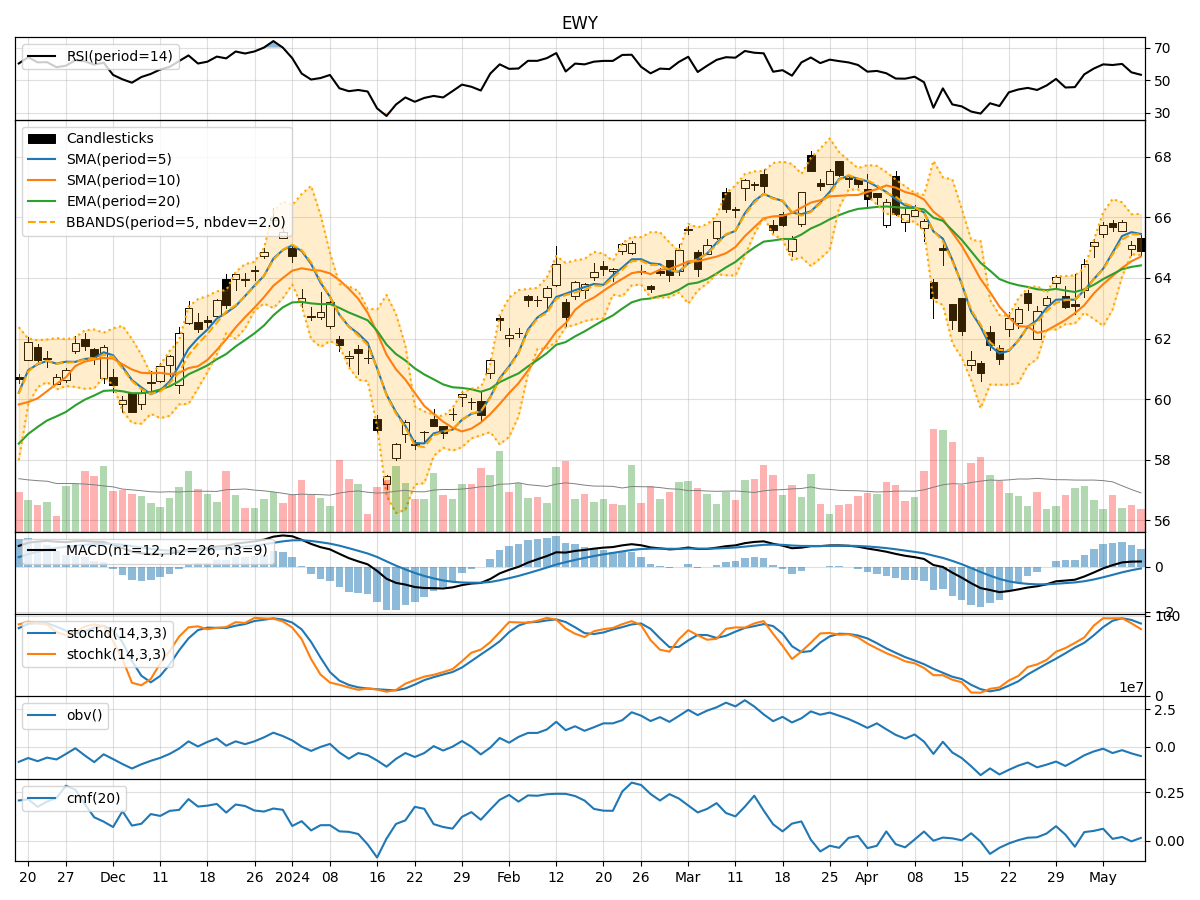
In analyzing the technical indicators for EWY over the last 5 days, we will delve into the trend, momentum, volatility, and volume indicators to provide a comprehensive outlook on the possible stock price movement in the coming days. By examining key metrics such as moving averages, MACD, RSI, Bollinger Bands, and OBV, we aim to offer valuable insights and recommendations for potential trading strategies.
Trend Indicators:
- Moving Averages (MA): The 5-day MA has been consistently above the 10-day SMA, indicating a short-term bullish trend.
- MACD: The MACD line has been above the signal line, suggesting positive momentum in the stock price.
- MACD Histogram: The histogram has been increasing, indicating strengthening bullish momentum.
Momentum Indicators:
- RSI: The RSI has been fluctuating around the 50 level, indicating a neutral stance in momentum.
- Stochastic Oscillator: Both %K and %D have been declining, signaling a potential reversal in momentum.
- Williams %R: The indicator has been in oversold territory, suggesting a possible upcoming bullish reversal.
Volatility Indicators:
- Bollinger Bands: The stock price has been trading within the bands, indicating a period of consolidation.
- Bollinger %B: The %B indicator has been hovering around the middle range, reflecting a neutral volatility outlook.
Volume Indicators:
- On-Balance Volume (OBV): The OBV has been declining, indicating selling pressure in the stock.
- Chaikin Money Flow (CMF): The CMF has been fluctuating around zero, suggesting a balance between buying and selling pressure.
Key Observations:
- The trend indicators suggest a bullish sentiment in the short term, supported by the moving averages and MACD.
- Momentum indicators show mixed signals, with RSI indicating neutrality, while stochastic and Williams %R hint at a potential bullish reversal.
- Volatility indicators point towards a period of consolidation, as the stock price remains within the Bollinger Bands.
- Volume indicators reflect selling pressure, as OBV has been on a downward trend, although CMF indicates a balance between buying and selling activity.
Conclusion:
Based on the analysis of the technical indicators, the next few days' possible stock price movement for EWY could see a sideways consolidation with a slight bullish bias. Traders may consider monitoring key support and resistance levels within the Bollinger Bands for potential entry and exit points. It is advisable to exercise caution and wait for clearer signals from momentum indicators before taking significant trading positions.