Technical Analysis of EWZS 2024-05-10
Overview:
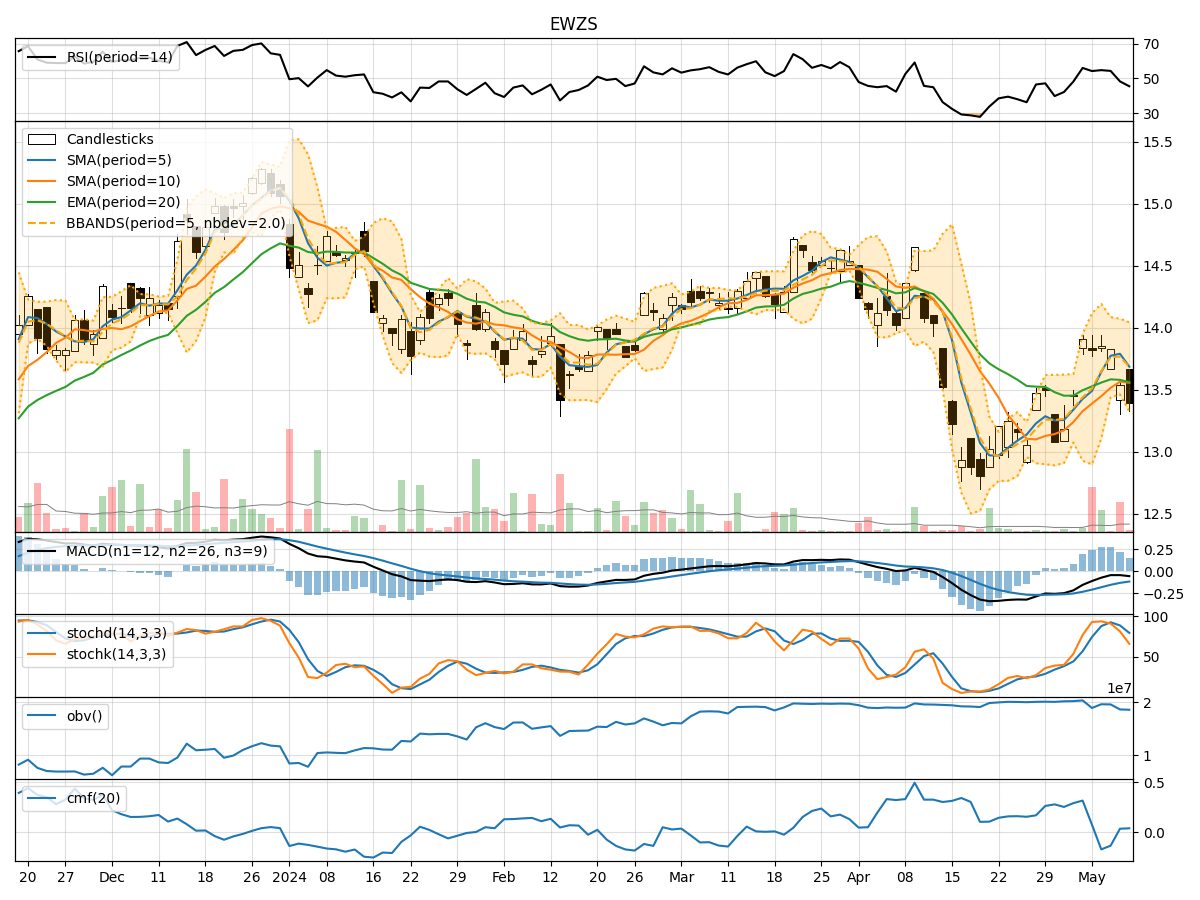
In analyzing the technical indicators for EWZS over the last 5 days, we will delve into the trend, momentum, volatility, and volume indicators to provide a comprehensive assessment of the stock's potential price movement. By examining these key factors, we aim to offer valuable insights and predictions for the next few days.
Trend Analysis:
- Moving Averages (MA): The 5-day MA has been fluctuating around the closing prices, indicating short-term price trends. The SMA(10) and EMA(20) have shown a slight upward trend, suggesting potential bullish momentum.
- Moving Average Convergence Divergence (MACD): The MACD line has been consistently below the signal line, indicating a bearish trend. However, the MACD histogram has shown signs of convergence, hinting at a possible trend reversal.
Momentum Analysis:
- Relative Strength Index (RSI): The RSI has been fluctuating around the 50 level, indicating a neutral momentum. There is no clear overbought or oversold signal.
- Stochastic Oscillator: The Stochastics have been declining, moving towards oversold territory. This suggests a potential reversal in momentum to the upside.
- Williams %R (WillR): The Williams %R has been in oversold territory, indicating a potential buying opportunity.
Volatility Analysis:
- Bollinger Bands (BB): The Bollinger Bands have been narrowing, suggesting decreasing volatility. The bands are currently close to the price, indicating a potential breakout in either direction.
- Bollinger %B (BBP): The %B indicator is hovering around the middle range, indicating a balanced market sentiment.
Volume Analysis:
- On-Balance Volume (OBV): The OBV has been relatively stable, indicating consistent buying pressure. This suggests underlying strength in the stock.
- Chaikin Money Flow (CMF): The CMF has been negative, indicating some distribution in the stock. However, the 20-day CMF shows a slight uptick, hinting at potential buying interest.
Key Observations:
- The trend indicators suggest a mixed outlook, with potential bullish signals from the SMA(10) and EMA(20) but bearish signals from the MACD.
- Momentum indicators show a neutral to slightly bearish stance, with oversold conditions in the Stochastics and Williams %R.
- Volatility indicators point towards decreasing volatility, potentially leading to a breakout.
- Volume indicators indicate stable buying pressure but some distribution in the stock.
Conclusion:
Based on the analysis of the technical indicators, the next few days for EWZS could see sideways consolidation with a slight bullish bias. Traders should watch for a potential breakout as volatility decreases. It is advisable to monitor the MACD for a possible trend reversal confirmation and the Stochastics for a momentum shift. Overall, a cautious approach with a focus on key support and resistance levels is recommended.