Technical Analysis of EXI 2024-05-10
Overview:
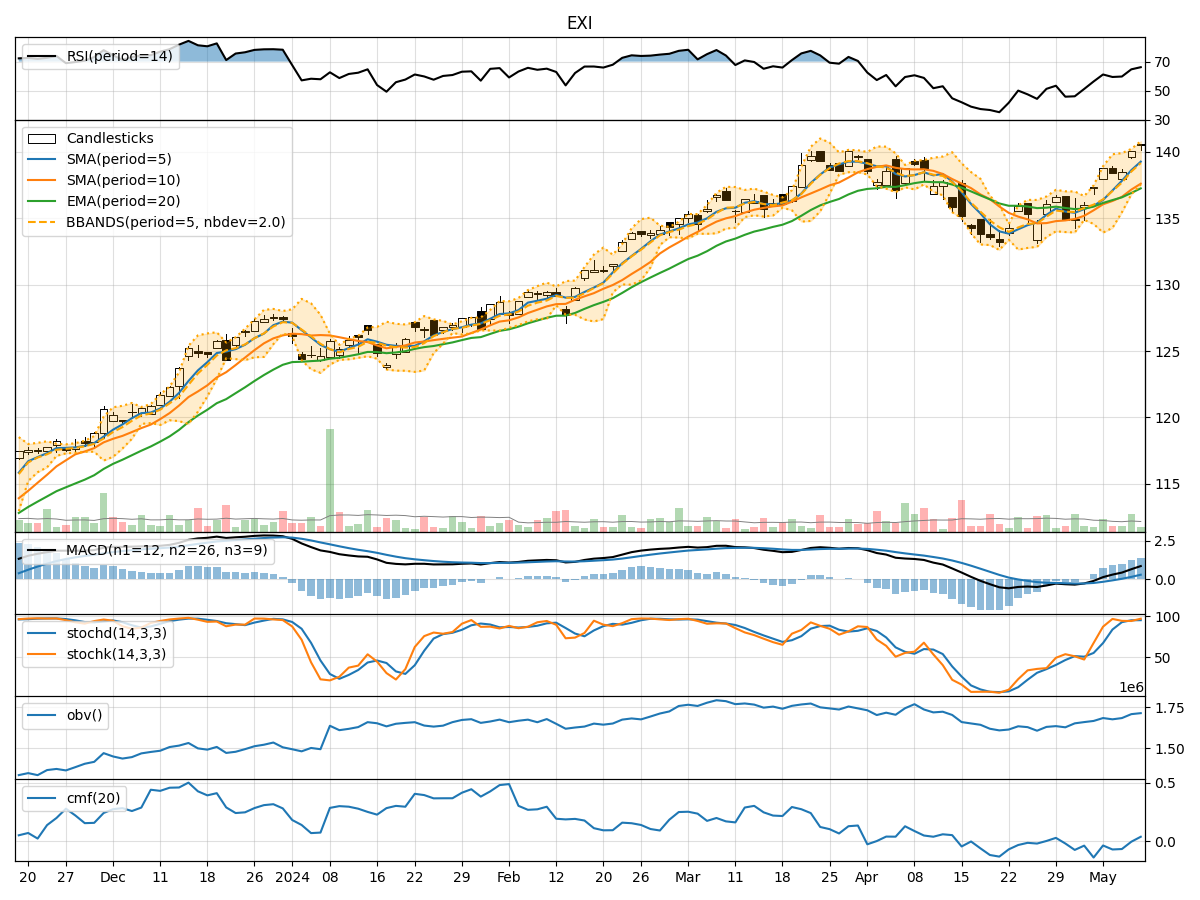
In analyzing the technical indicators for EXI over the last 5 days, we will delve into the trend, momentum, volatility, and volume indicators to provide a comprehensive outlook on the possible stock price movement in the coming days. By examining these key indicators, we aim to offer valuable insights and predictions for potential investors.
Trend Indicators:
- Moving Averages (MA): The 5-day MA has been consistently rising, indicating a bullish trend in the short term.
- MACD: The MACD line has been above the signal line, suggesting positive momentum in the stock price.
- RSI: The RSI has been increasing, reflecting strengthening buying pressure.
Momentum Indicators:
- Stochastic Oscillator: Both %K and %D have been in the overbought zone, signaling a potential reversal or consolidation.
- Williams %R: The indicator has been hovering near oversold levels, indicating a possible buying opportunity.
Volatility Indicators:
- Bollinger Bands (BB): The stock price has been trading within the bands, indicating normal volatility.
- BB %B: The %B indicator has been fluctuating within a normal range, suggesting no extreme conditions.
Volume Indicators:
- On-Balance Volume (OBV): The OBV has shown mixed signals, reflecting indecision among market participants.
- Chaikin Money Flow (CMF): The CMF has been negative, indicating selling pressure in the stock.
Key Observations:
- The trend indicators suggest a bullish sentiment in the short term.
- Momentum indicators show signs of potential overbought conditions.
- Volatility indicators point towards normal price fluctuations.
- Volume indicators indicate mixed signals with a slight bias towards selling pressure.
Conclusion:
Based on the analysis of the technical indicators, the next few days' possible stock price movement for EXI could see a short-term consolidation or a minor pullback due to the overbought conditions indicated by the momentum indicators. However, the overall trend remains bullish, supported by the moving averages and MACD. Investors should closely monitor the stochastic oscillator for potential reversal signals and consider the negative CMF as a cautionary sign. Overall, a sideways movement or a slight correction in the stock price is likely in the near future.