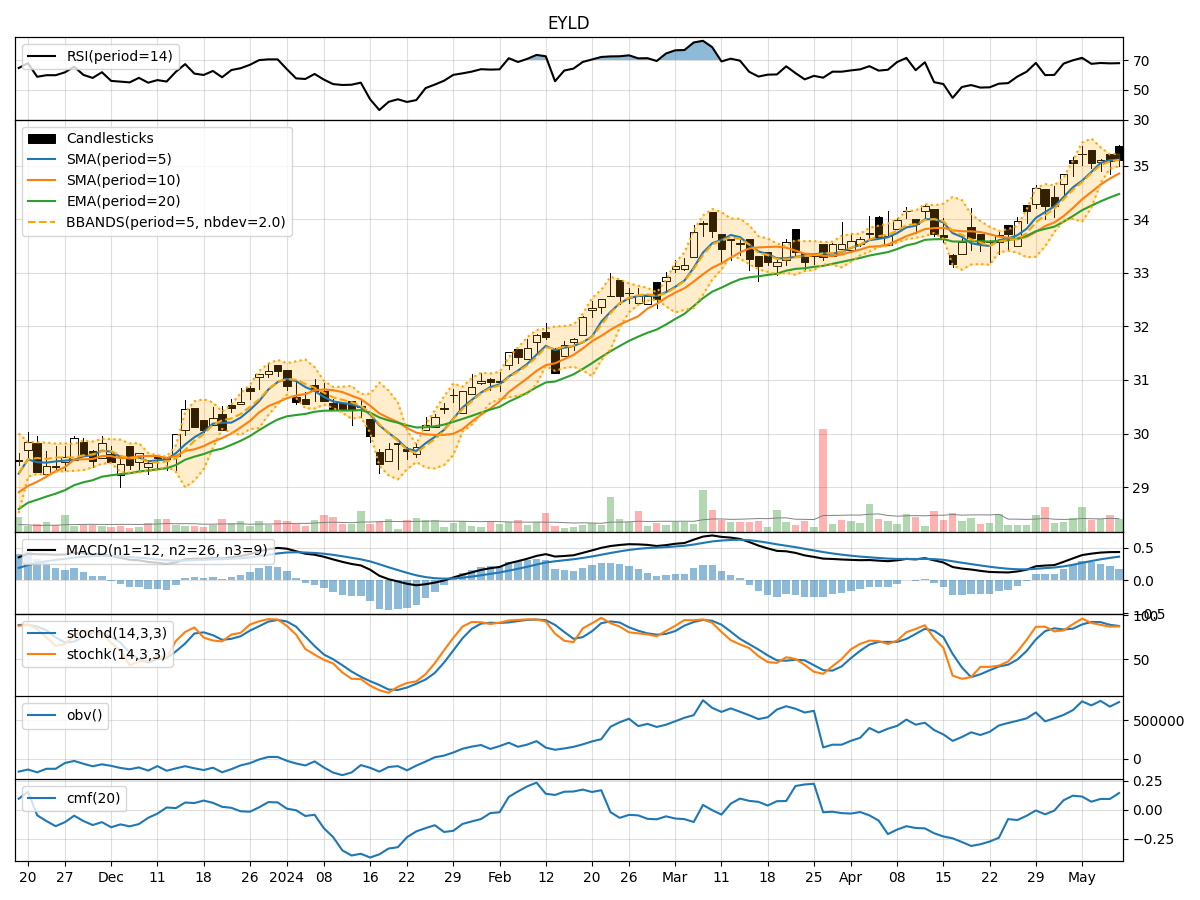
Technical Analysis of EYLD 2024-05-10
Overview:
In the last 5 trading days, EYLD stock has shown a consistent uptrend based on the moving averages, with the closing price gradually increasing. Momentum indicators like RSI and Stochastic oscillators suggest the stock is in overbought territory. Volatility indicators show a narrowing of the Bollinger Bands, indicating potential consolidation. Volume indicators reflect mixed signals with fluctuations in On-Balance Volume (OBV) and Chaikin Money Flow (CMF).
Trend Analysis:
- Moving Averages (MA): The 5-day MA has been consistently above the 10-day SMA, indicating a short-term bullish trend. The EMA(20) has also been trending upwards, supporting the bullish sentiment.
- MACD: The MACD line has been above the signal line, with both lines in positive territory. The MACD Histogram has been decreasing but remains positive, suggesting a potential slowdown in bullish momentum.
Momentum Analysis:
- RSI: The RSI has been consistently above 70, indicating overbought conditions. This could signal a potential reversal or correction in the stock price.
- Stochastic Oscillators: Both %K and %D have been in the overbought zone, suggesting a possible pullback in the stock price. The Williams %R is also in oversold territory, indicating a bearish sentiment.
Volatility Analysis:
- Bollinger Bands (BB): The narrowing of the Bollinger Bands suggests decreasing volatility and a potential period of consolidation. The %B indicator is hovering around the middle, indicating a balanced market sentiment.
Volume Analysis:
- On-Balance Volume (OBV): The OBV has shown fluctuations, indicating mixed buying and selling pressure. This could suggest indecision among market participants.
- Chaikin Money Flow (CMF): The CMF has been positive but fluctuating, reflecting uncertainty in the stock's price direction.
Conclusion:
Based on the technical indicators and analysis: - Trend: The stock is in an upward trend supported by moving averages and MACD, but the MACD Histogram's decrease may signal a potential slowdown. - Momentum: Momentum indicators like RSI and Stochastic oscillators suggest the stock is overbought, indicating a possible correction or pullback. - Volatility: The narrowing Bollinger Bands indicate a period of consolidation and decreasing volatility, potentially leading to a sideways movement. - Volume: Mixed signals in OBV and CMF suggest indecisiveness among investors.
Overall Opinion:
Considering the overbought conditions in momentum indicators, potential slowdown in bullish momentum indicated by MACD, and mixed signals in volume indicators, the next few days for EYLD stock could see a sideways movement or a minor correction. Traders should exercise caution and monitor key support and resistance levels for potential entry or exit points.