Technical Analysis of EZJ 2024-05-10
Overview:
In analyzing the technical indicators for EZJ over the last 5 days, we will delve into the trend, momentum, volatility, and volume indicators to provide a comprehensive outlook on the possible stock price movement in the coming days. By examining these key indicators, we aim to offer valuable insights and predictions for potential investors.
Trend Analysis:
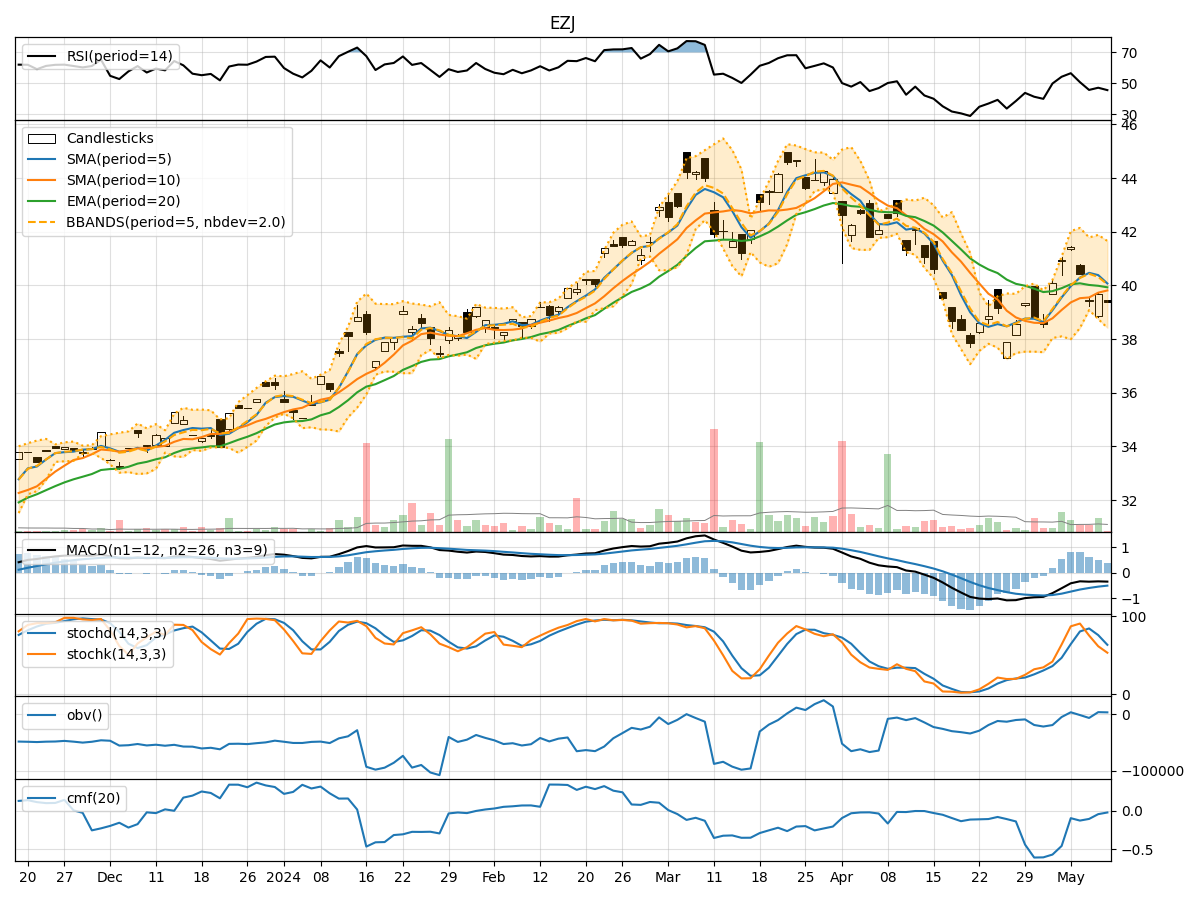
- Moving Averages (MA): The 5-day Moving Average (MA) has been fluctuating around the closing prices, indicating short-term price trends. The Simple Moving Average (SMA) and Exponential Moving Average (EMA) show a slight downward trend, suggesting a bearish sentiment.
- MACD: The Moving Average Convergence Divergence (MACD) has been negative, with the MACD line consistently below the signal line. This indicates a bearish trend in the stock price.
- Conclusion: The trend indicators suggest a bearish outlook for EZJ in the short term.
Momentum Analysis:
- RSI: The Relative Strength Index (RSI) has been declining, indicating weakening momentum in the stock price movement.
- Stochastic Oscillator: Both %K and %D values have been decreasing, signaling a potential downtrend in price.
- Conclusion: Momentum indicators point towards a bearish momentum for EZJ.
Volatility Analysis:
- Bollinger Bands (BB): The Bollinger Bands have been narrowing, suggesting decreasing volatility in the stock price.
- Conclusion: Volatility indicators indicate a decreasing volatility in EZJ, potentially leading to a period of consolidation.
Volume Analysis:
- On-Balance Volume (OBV): The OBV has been fluctuating, indicating mixed buying and selling pressure.
- Chaikin Money Flow (CMF): The CMF has been negative, suggesting a bearish money flow trend.
- Conclusion: Volume indicators show a mixed sentiment with a slight bearish bias.
Overall Conclusion:
Based on the analysis of trend, momentum, volatility, and volume indicators, the overall outlook for EZJ in the next few days is bearish. The trend indicators, momentum indicators, and volume indicators all point towards a potential downward movement in the stock price. The decreasing volatility may lead to a period of consolidation before a potential further decline.
Recommendation:
Investors should exercise caution and consider waiting for more confirmation before making any trading decisions. It is advisable to closely monitor the price action and key support levels to assess the potential entry or exit points. Short-term traders may consider taking a bearish stance, while long-term investors may evaluate the situation for a possible entry point at lower levels.
Disclaimer:
Please note that technical analysis is not a guaranteed predictor of future price movements, and other fundamental factors can also influence stock prices. It is essential to conduct thorough research and consider multiple indicators before making any investment decisions. Consulting with a financial advisor is recommended for personalized investment advice tailored to individual risk tolerance and financial goals.