Technical Analysis of EZM 2024-05-10
Overview:
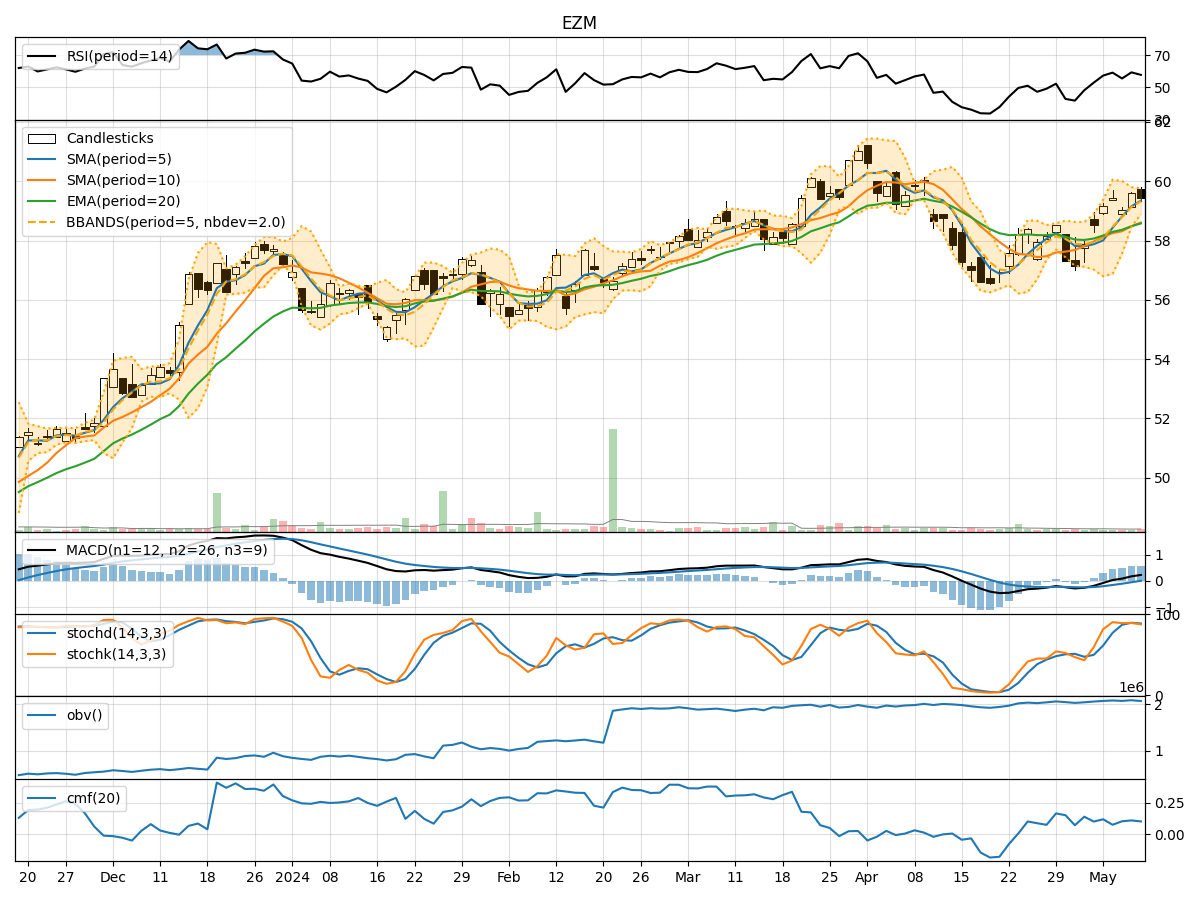
In analyzing the technical indicators for EZM over the last 5 days, we will delve into the trend, momentum, volatility, and volume indicators to provide a comprehensive outlook on the possible stock price movement in the coming days.
Trend Indicators:
- Moving Averages (MA): The 5-day MA has been consistently above the closing prices, indicating a bullish trend.
- MACD: The MACD line has been above the signal line, suggesting a bullish momentum.
- RSI: The RSI values have been relatively high, indicating overbought conditions.
Momentum Indicators:
- Stochastic Oscillator: Both %K and %D have been in the overbought zone, signaling a potential reversal.
- Williams %R: The values have been in the oversold territory, indicating a possible bullish reversal.
Volatility Indicators:
- Bollinger Bands: The stock price has been trading within the bands, suggesting a period of consolidation.
- BB% (Bollinger Band %B): The %B values have been fluctuating around the midline, indicating a lack of clear trend direction.
Volume Indicators:
- On-Balance Volume (OBV): The OBV has been relatively stable, showing consistent buying interest.
- Chaikin Money Flow (CMF): The CMF values have been positive, indicating money flow into the stock.
Key Observations:
- The trend indicators suggest a bullish sentiment with the MA and MACD supporting upward momentum.
- Momentum indicators show conflicting signals with the Stochastic Oscillator in overbought territory and Williams %R in oversold territory.
- Volatility indicators point towards a period of consolidation with the stock trading within the Bollinger Bands.
- Volume indicators indicate consistent buying interest as seen in the stable OBV and positive CMF values.
Conclusion:
Based on the analysis of the technical indicators, the next few days for EZM could see further upward movement in the stock price. The bullish trend indicated by the moving averages and MACD, coupled with stable volume indicators, suggests a potential continuation of the current uptrend. However, caution is advised due to conflicting signals from momentum indicators like the Stochastic Oscillator and Williams %R. Traders should closely monitor price action for confirmation of the bullish bias and be prepared for potential reversals in the short term.