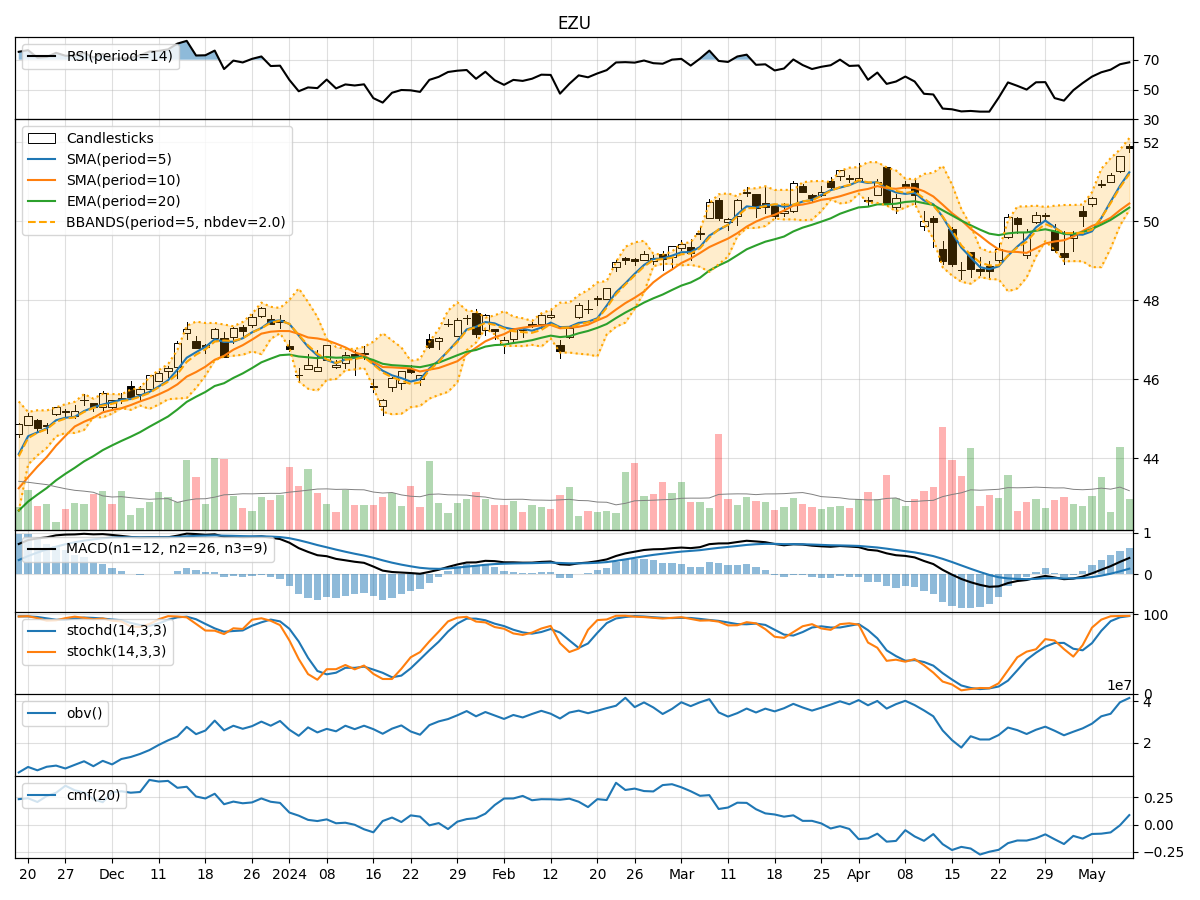
Technical Analysis of EZU 2024-05-10
Overview:
In analyzing the technical indicators for EZU over the last 5 days, we will delve into the trend, momentum, volatility, and volume indicators to provide a comprehensive outlook on the possible stock price movement in the coming days.
Trend Analysis:
- Moving Averages (MA): The 5-day MA has been consistently rising, indicating a bullish trend in the short term.
- MACD: The MACD line has been above the signal line, suggesting positive momentum.
- RSI: The RSI is in the overbought territory, indicating a potential reversal or consolidation.
Momentum Analysis:
- Stochastic Oscillator: Both %K and %D are in the overbought zone, signaling a potential pullback.
- Williams %R: The indicator is also in the oversold region, supporting the likelihood of a downward correction.
Volatility Analysis:
- Bollinger Bands (BB): The bands have been widening, indicating increased volatility in the stock price.
- BB %B: The %B is below 1, suggesting the stock is trading below the lower band, potentially oversold.
Volume Analysis:
- On-Balance Volume (OBV): The OBV has been fluctuating, indicating indecision among investors.
- Chaikin Money Flow (CMF): The CMF is negative, reflecting selling pressure in the stock.
Key Observations:
- The stock is currently in a bullish trend based on moving averages and MACD.
- Momentum indicators suggest a potential pullback due to overbought conditions.
- Volatility has increased, indicating higher price fluctuations.
- Volume indicators show mixed signals with fluctuating OBV and negative CMF.
Conclusion:
Based on the analysis of technical indicators, the next few days may see a short-term correction or consolidation in the stock price. The overbought momentum signals and negative CMF suggest a possible pullback, while the bullish trend and widening Bollinger Bands indicate underlying strength. Investors should monitor the price action closely for potential entry or exit points, considering the mixed signals from volume indicators. Exercise caution and consider a balanced approach in trading or investing in EZU in the coming days.