Technical Analysis of FAAR 2024-05-10
Overview:
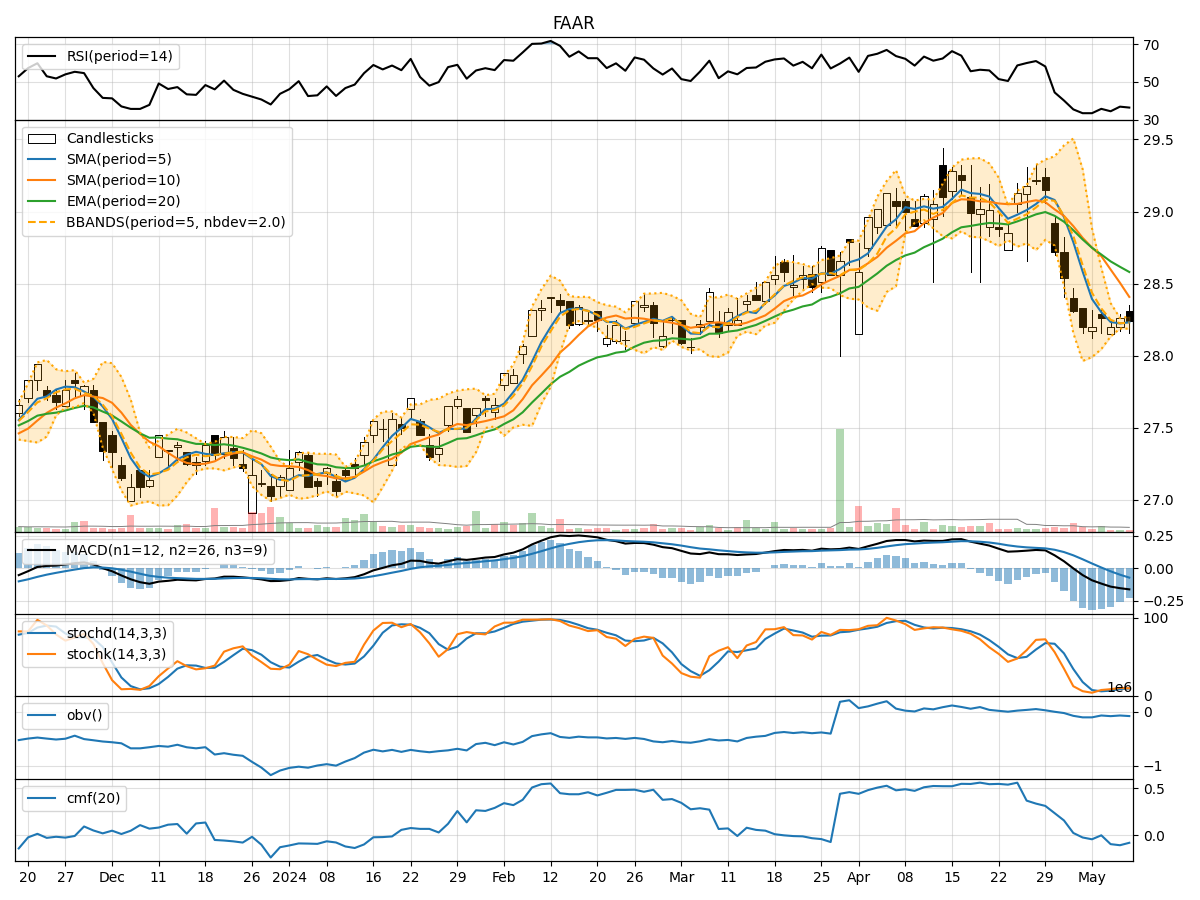
In analyzing the provided FAAR TA data for the last 5 days, we will delve into the technical indicators across trend, momentum, volatility, and volume to derive insights into the possible future stock price movement. By examining these indicators comprehensively, we aim to provide a well-structured and informed prediction for the upcoming days.
Trend Analysis:
- Moving Averages (MA): The 5-day MA has been consistently below the closing prices, indicating a short-term downtrend.
- MACD: The MACD line has been negative, with the MACD histogram also showing a downward trend, suggesting bearish momentum.
Momentum Analysis:
- RSI: The RSI values have been relatively low, indicating potential oversold conditions.
- Stochastic Oscillator: Both %K and %D values have been below 20, signaling an oversold market.
Volatility Analysis:
- Bollinger Bands (BB): The stock price has been trading within the lower Bollinger Band, suggesting a potential oversold condition.
Volume Analysis:
- On-Balance Volume (OBV): The OBV has been fluctuating but generally trending downwards, indicating selling pressure.
- Chaikin Money Flow (CMF): The CMF has been negative, reflecting a lack of buying interest.
Key Observations:
- The stock is currently in a downtrend based on moving averages and MACD.
- Momentum indicators suggest the stock is oversold.
- Volatility indicators point towards a potential oversold condition.
- Volume indicators show selling pressure and a lack of buying interest.
Conclusion:
Based on the analysis of the technical indicators, the next few days' possible stock price movement is likely to be sideways to slightly bullish. While the stock is currently in a downtrend, the oversold conditions indicated by momentum and volatility indicators could lead to a temporary consolidation or a minor uptick in the stock price. However, the overall sentiment remains cautious due to the selling pressure and lack of significant buying interest reflected in the volume indicators.
Recommendation:
- Short-term traders: Consider potential buying opportunities if the stock shows signs of reversal from oversold levels.
- Long-term investors: Exercise caution and wait for more definitive signals of a trend reversal before considering entry positions.
By carefully monitoring the stock's price action in conjunction with these technical indicators, investors can make more informed decisions aligned with the prevailing market dynamics.