Technical Analysis of FAD 2024-05-10
Overview:
In analyzing the technical indicators for FAD stock over the last 5 days, we will delve into the trend, momentum, volatility, and volume indicators to provide a comprehensive outlook on the possible stock price movement in the coming days. By examining these key indicators, we aim to offer valuable insights and predictions for potential investors.
Trend Analysis:
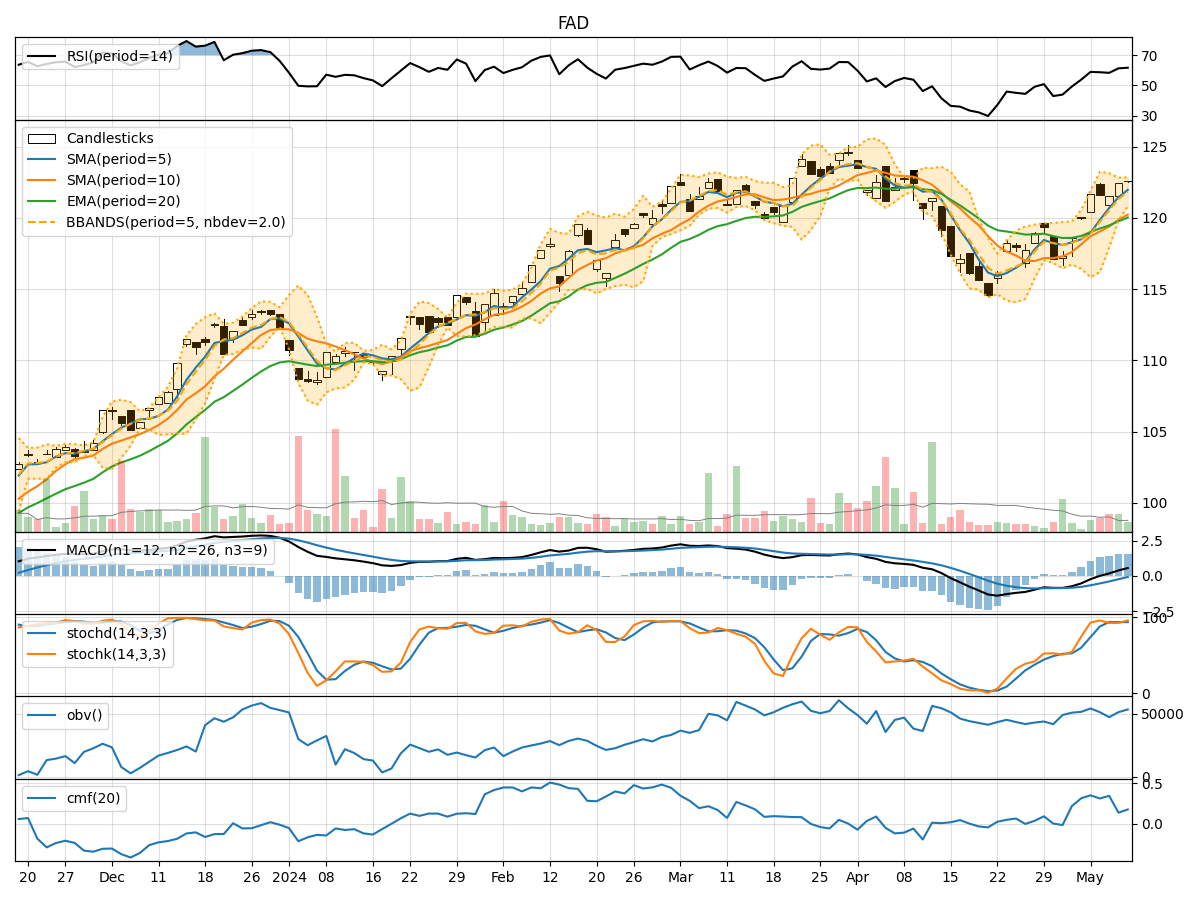
- Moving Averages (MA): The 5-day Moving Average (MA) has been consistently rising, indicating a bullish trend in the short term.
- MACD: The MACD line has been above the signal line for the past 5 days, suggesting a bullish momentum.
- EMA: The Exponential Moving Average has also been trending upwards, supporting the bullish sentiment.
Momentum Analysis:
- RSI: The Relative Strength Index (RSI) has been in the neutral zone, indicating neither overbought nor oversold conditions.
- Stochastic Oscillator: Both %K and %D have been fluctuating but generally staying in the overbought territory, suggesting potential for a pullback.
- Williams %R: The Williams %R is hovering around the oversold region, indicating a possible reversal.
Volatility Analysis:
- Bollinger Bands: The stock price has been trading within the Bollinger Bands, with the bands narrowing, indicating decreasing volatility.
- Bollinger %B: The %B indicator is above 0.5, suggesting a bullish trend.
Volume Analysis:
- On-Balance Volume (OBV): The OBV has been fluctuating, indicating mixed buying and selling pressure.
- Chaikin Money Flow (CMF): The CMF has been positive but decreasing, signaling potential profit-taking.
Key Observations:
- The trend indicators suggest a bullish sentiment in the short term.
- Momentum indicators show a mixed picture with potential for a pullback.
- Volatility is decreasing, indicating a possible consolidation phase.
- Volume indicators reflect mixed buying and selling pressure.
Conclusion:
Based on the analysis of the technical indicators, the next few days for FAD stock are likely to see sideways movement with a slight bullish bias. Traders should watch for potential pullbacks indicated by the momentum indicators and monitor the volume for any significant shifts in buying or selling pressure. It is advisable to set tight stop-loss levels to manage risk effectively in this uncertain market environment.