Technical Analysis of FALN 2024-05-10
Overview:
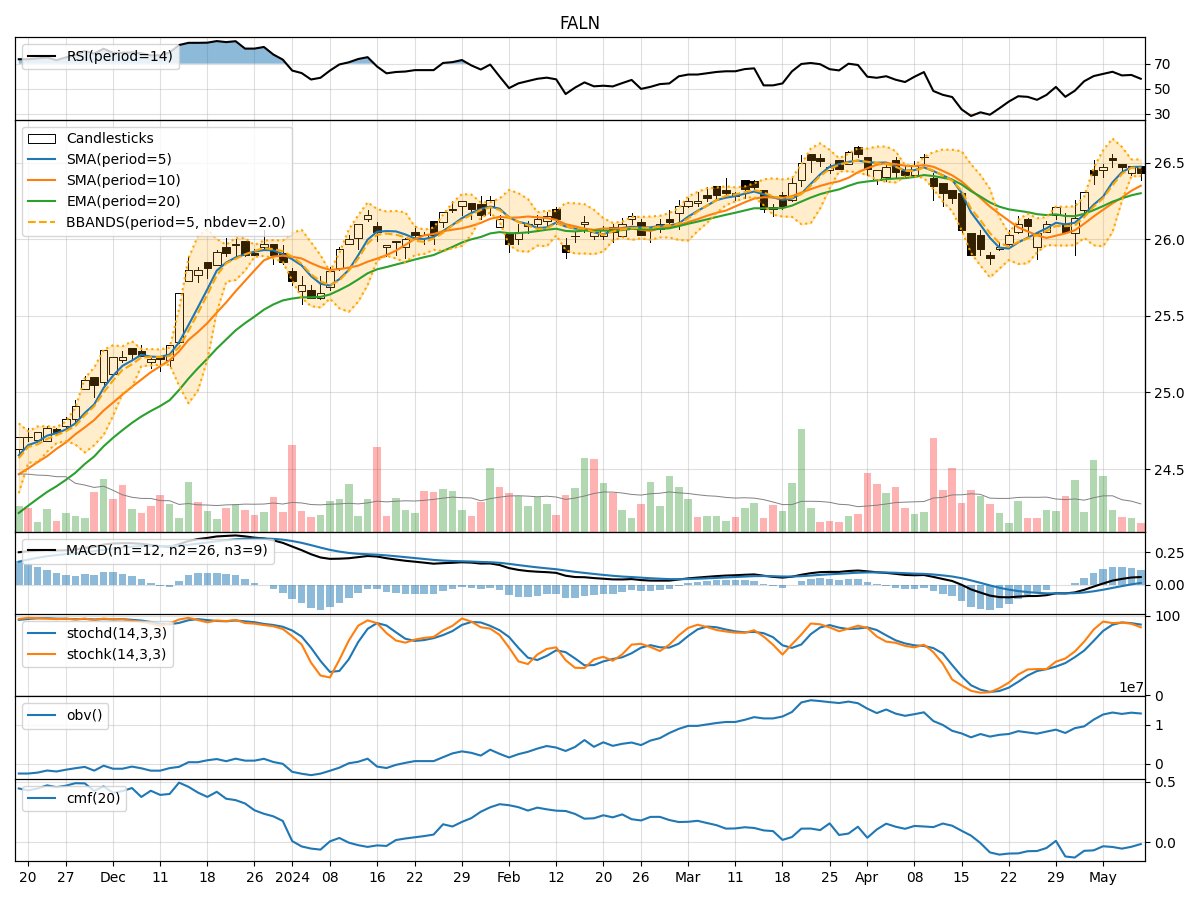
In analyzing the technical indicators for FALN over the last 5 days, we will delve into the trend, momentum, volatility, and volume indicators to provide a comprehensive outlook on the possible stock price movement in the coming days. By examining these key indicators, we aim to offer valuable insights and predictions for informed decision-making.
Trend Indicators:
- Moving Averages (MA): The 5-day moving average has been steadily increasing, indicating a positive trend in the short term.
- MACD: The MACD line has been consistently above the signal line, suggesting bullish momentum.
- EMA: The exponential moving average has been trending upwards, supporting the bullish sentiment.
Momentum Indicators:
- RSI: The Relative Strength Index has been hovering around the neutral zone, indicating a balanced momentum.
- Stochastic Oscillator: Both %K and %D have been declining, signaling a potential reversal in momentum.
- Williams %R: The indicator has been in oversold territory, suggesting a possible upcoming bullish reversal.
Volatility Indicators:
- Bollinger Bands: The bands have been narrowing, indicating decreasing volatility and a potential breakout in the near future.
- Bollinger %B: The %B indicator is currently below 1, suggesting a possible oversold condition.
Volume Indicators:
- On-Balance Volume (OBV): The OBV has been fluctuating, indicating indecision among market participants.
- Chaikin Money Flow (CMF): The CMF has been negative, reflecting selling pressure in the market.
Key Observations and Opinions:
- Trend: The trend indicators suggest a bullish sentiment in the short term.
- Momentum: Momentum indicators show mixed signals, with a potential for a bullish reversal based on oversold conditions.
- Volatility: Volatility indicators point towards a potential breakout, with decreasing volatility.
- Volume: Volume indicators reflect uncertainty and selling pressure in the market.
Conclusion:
Based on the analysis of the technical indicators, the next few days' possible stock price movement for FALN is likely to be bullish in the short term. The trend indicators support a positive outlook, while momentum indicators hint at a potential bullish reversal. Volatility indicators suggest a breakout, and volume indicators indicate selling pressure. Considering these factors, investors may expect an upward movement in the stock price in the coming days.