Technical Analysis of FAPR 2024-05-10
Overview:
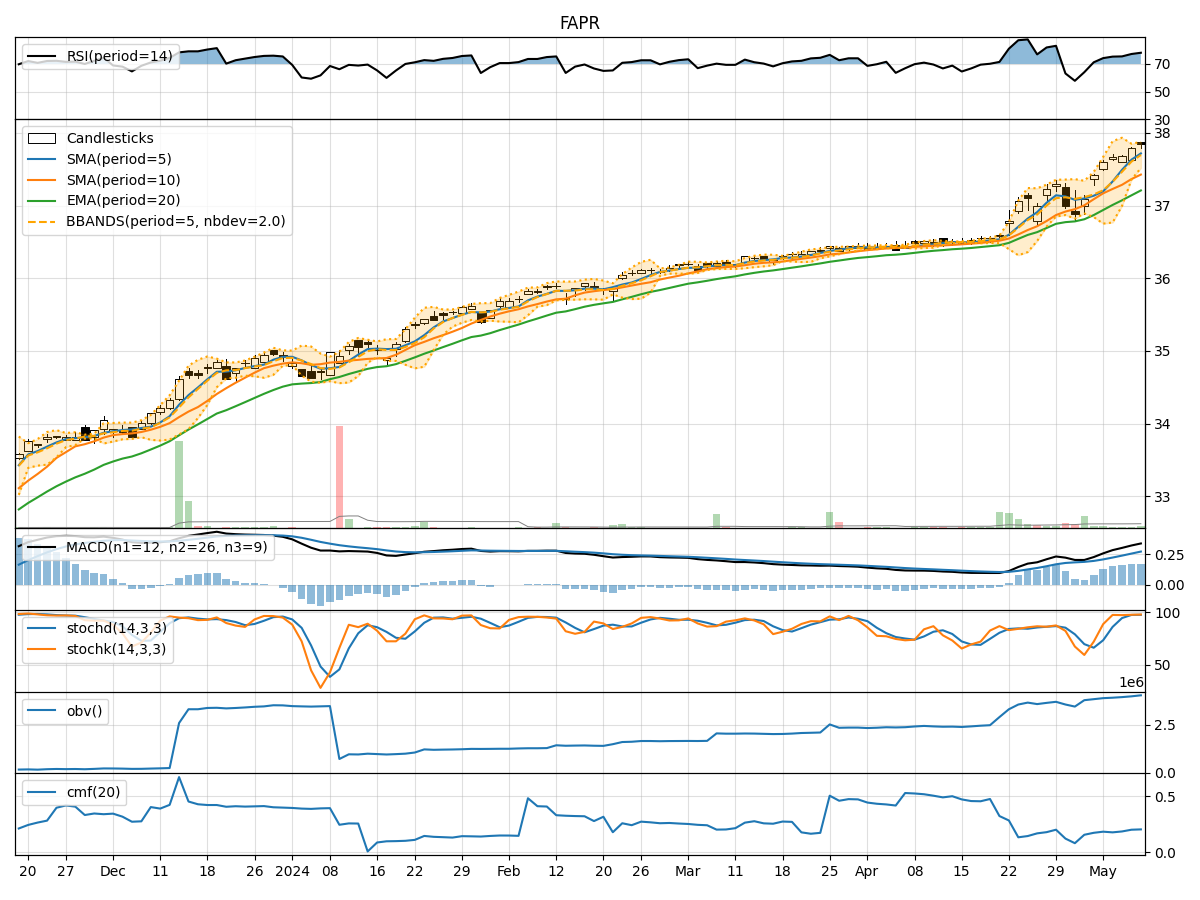
In the last 5 trading days, FAPR stock has shown a consistent uptrend in its price, supported by positive momentum and volatility indicators. The stock has been trading above its moving averages, with the MACD signaling a bullish trend. Momentum indicators like RSI and Stochastic oscillators are in overbought territory, indicating strong buying pressure. Volatility has been relatively low, suggesting stability in the stock price movement. Volume indicators show a positive trend in accumulation/distribution.
Trend Analysis:
- Moving Averages (MA): The stock price has been consistently above the 5-day moving average, indicating a short-term uptrend.
- MACD: The MACD line is above the signal line, confirming a bullish trend.
- EMA: The exponential moving average has been trending upwards, supporting the bullish momentum.
Key Observation: The trend indicators suggest a strong bullish sentiment in the stock price movement.
Momentum Analysis:
- RSI: The Relative Strength Index is in the overbought zone, indicating a potential reversal or consolidation.
- Stochastic Oscillators: Both %K and %D are in the overbought region, signaling a possible pullback.
- Williams %R: The Williams %R is also in the oversold territory, suggesting a potential reversal.
Key Observation: Momentum indicators are showing signs of potential exhaustion in the buying pressure.
Volatility Analysis:
- Bollinger Bands: The stock price has been trading within the bands, indicating stability.
- Bollinger %B: The %B is above 0.5, suggesting a bullish trend.
- Bollinger Band Width: The band width has been narrowing, indicating reduced volatility.
Key Observation: Volatility indicators point towards a stable price movement with a slight bullish bias.
Volume Analysis:
- On-Balance Volume (OBV): The OBV has been steadily increasing, indicating accumulation by investors.
- Chaikin Money Flow (CMF): The CMF is positive, suggesting buying pressure in the stock.
Key Observation: Volume indicators support the bullish sentiment in the stock price.
Conclusion:
Based on the analysis of the technical indicators, the next few days' possible stock price movement for FAPR is likely to experience a short-term pullback or consolidation. The stock has been in overbought territory according to momentum indicators, signaling a potential reversal in the uptrend. While the trend remains bullish, the high RSI and Stochastic levels suggest a temporary pause or correction in the price. Volatility is expected to remain low, indicating a stable price movement.
Key Conclusion: Expect a short-term correction or consolidation in the stock price movement of FAPR in the coming days.