Technical Analysis of FBT 2024-05-10
Overview:
In analyzing the technical indicators for FBT stock over the last 5 days, we will delve into the trend, momentum, volatility, and volume indicators to provide a comprehensive outlook on the possible stock price movement in the coming days. By examining these key aspects, we aim to offer valuable insights and predictions to guide your investment decisions.
Trend Analysis:
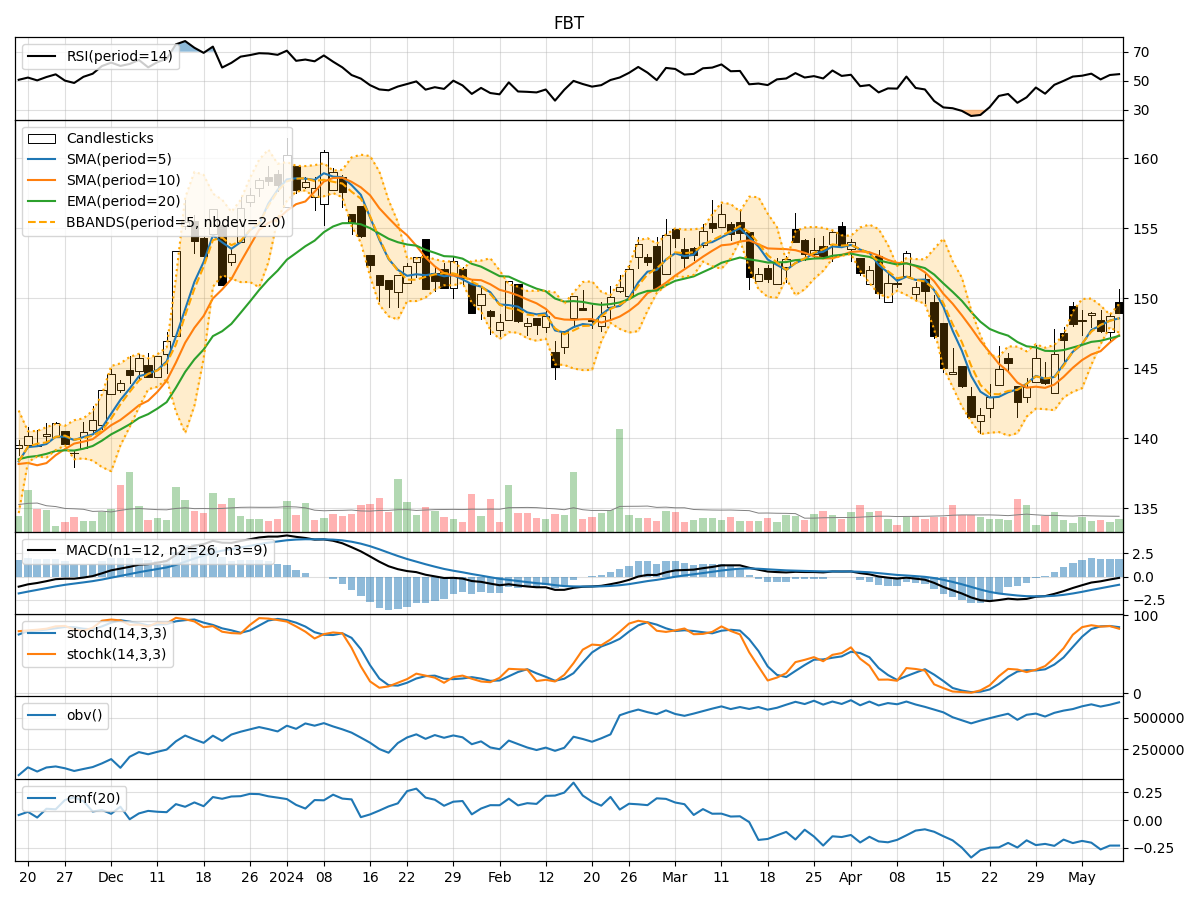
- Moving Averages (MA): The 5-day Moving Average (MA) has been consistently above the Simple Moving Average (SMA) and Exponential Moving Average (EMA), indicating a bullish trend.
- MACD: The MACD line has been consistently above the signal line, suggesting bullish momentum in the stock price.
- MACD Histogram: The MACD Histogram has been consistently positive, further supporting the bullish trend.
Momentum Analysis:
- RSI: The Relative Strength Index (RSI) has been fluctuating around the 50 level, indicating a neutral momentum in the stock.
- Stochastic Oscillator: Both %K and %D lines of the Stochastic Oscillator have been fluctuating within the overbought territory, suggesting a potential reversal in the stock price.
- Williams %R: The Williams %R indicator has been hovering in the oversold region, signaling a possible bullish reversal.
Volatility Analysis:
- Bollinger Bands: The Bollinger Bands have been relatively narrow, indicating low volatility in the stock price.
- Bollinger %B: The %B indicator has been fluctuating around the middle range, suggesting a lack of strong directional bias in the stock.
Volume Analysis:
- On-Balance Volume (OBV): The OBV indicator has been showing mixed signals, reflecting indecision among market participants.
- Chaikin Money Flow (CMF): The CMF indicator has been negative, indicating selling pressure in the stock.
Conclusion:
Based on the analysis of the technical indicators, the stock of FBT is currently exhibiting a sideways trend with neutral momentum and low volatility. The volume indicators suggest a lack of strong buying interest in the stock. Considering the mixed signals from the indicators, it is likely that the stock price of FBT will continue to consolidate in the near term.
Recommendation:
Given the current market dynamics and technical signals, it is advisable to exercise caution and closely monitor the stock price movement. Consider waiting for clearer signals or confirmation of a new trend before making any significant trading decisions. It is essential to conduct further analysis and keep a close eye on key support and resistance levels for better decision-making.