Technical Analysis of FBZ 2024-05-10
Overview:
In analyzing the technical indicators for FBZ over the last 5 days, we will delve into the trend, momentum, volatility, and volume indicators to provide a comprehensive outlook on the possible stock price movement. By examining these key aspects, we aim to offer valuable insights and predictions for the upcoming days.
Trend Analysis:
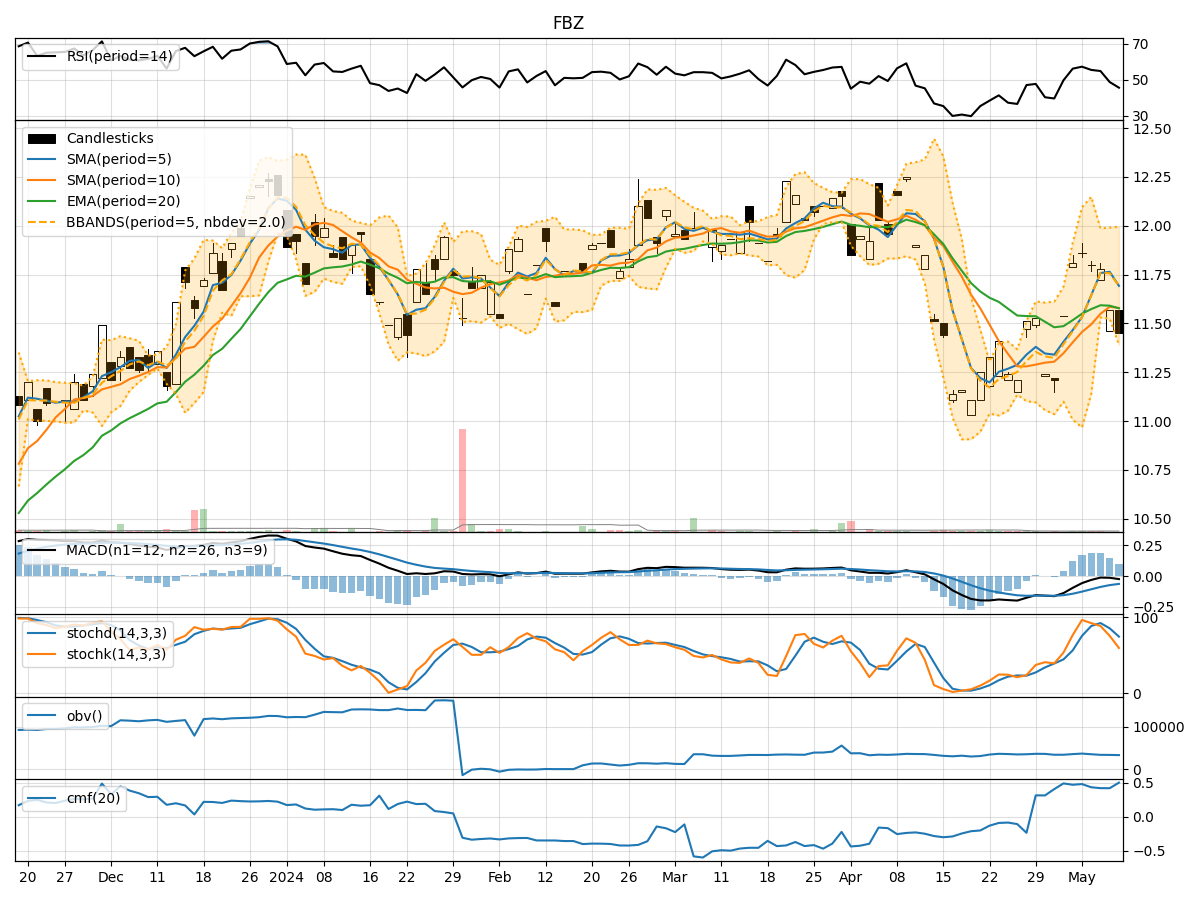
- Moving Averages (MA): The 5-day MA has been fluctuating around the closing prices, indicating short-term price trends. The SMA(10) and EMA(20) have shown a slight upward trend, suggesting potential support levels.
- MACD: The MACD line has been consistently below the signal line, indicating a bearish momentum in the short term.
- MACD Histogram: The MACD histogram has been decreasing, signaling a weakening bearish momentum.
Momentum Analysis:
- RSI: The RSI has been declining, moving towards the oversold territory, indicating a potential reversal or consolidation phase.
- Stochastic Oscillator: Both %K and %D have been decreasing, suggesting a bearish momentum.
- Williams %R: The indicator has been in the oversold region, indicating a potential buying opportunity.
Volatility Analysis:
- Bollinger Bands (BB): The bands have been narrowing, indicating decreasing volatility and a possible consolidation phase.
- Bollinger %B: The %B indicator has been hovering around the middle, suggesting a balanced market sentiment.
Volume Analysis:
- On-Balance Volume (OBV): The OBV has been declining, indicating selling pressure in the market.
- Chaikin Money Flow (CMF): The CMF has been relatively stable, showing a neutral money flow trend.
Key Observations:
- The trend indicators suggest a mixed outlook with a slight upward bias in the short term.
- Momentum indicators point towards a bearish sentiment, but nearing oversold levels.
- Volatility indicators indicate decreasing volatility and a potential consolidation phase.
- Volume indicators show selling pressure but with a stable money flow.
Conclusion:
Based on the analysis of the technical indicators, the next few days for FBZ stock price movement are likely to be sideways with a slight downward bias. Traders should exercise caution and monitor key support levels closely. Consider waiting for a clearer trend confirmation before making significant trading decisions.