Technical Analysis of FCAL 2024-05-10
Overview:
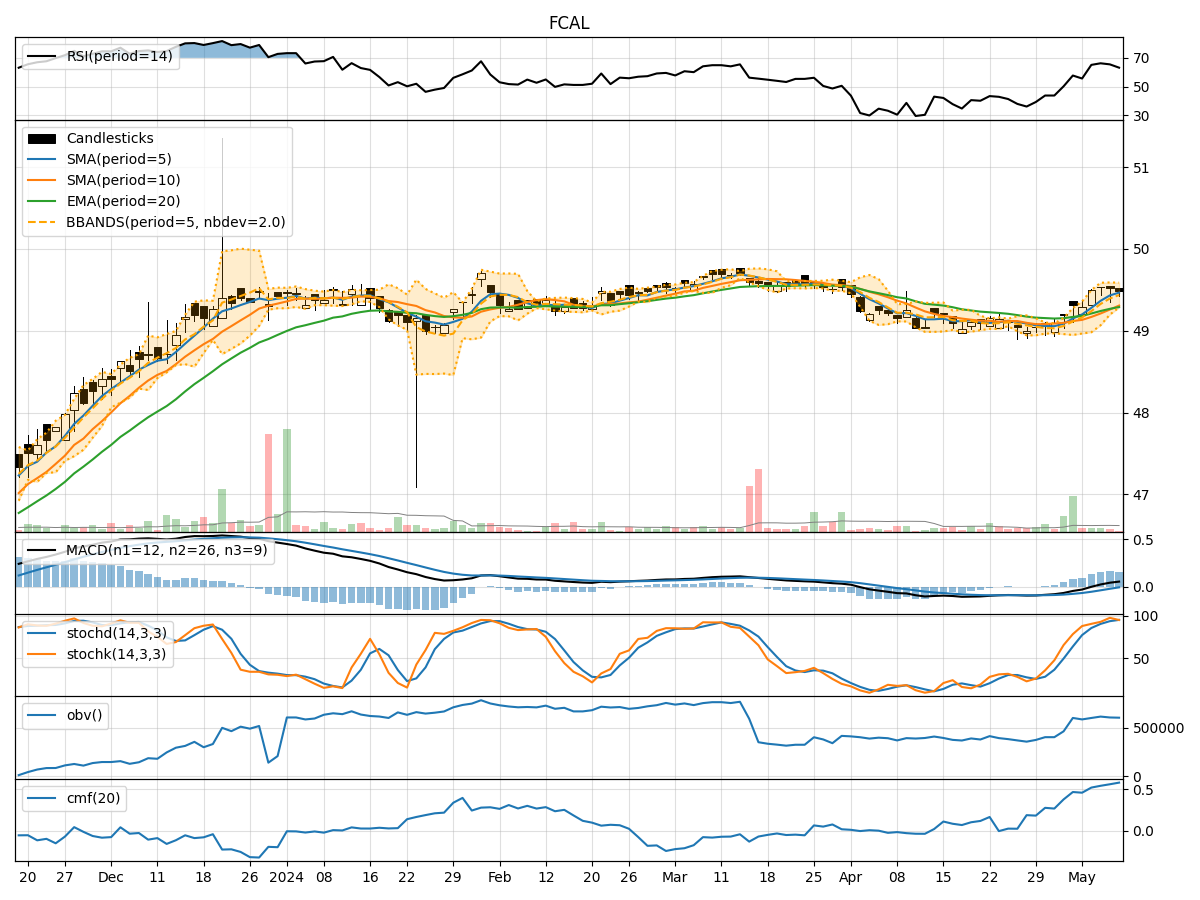
In analyzing the technical indicators for FCAL over the last 5 days, we will delve into the trend, momentum, volatility, and volume indicators to provide a comprehensive outlook on the possible stock price movement in the coming days. By examining these key indicators, we aim to offer valuable insights and predictions for potential investors.
Trend Analysis:
- Moving Averages (MA): The 5-day MA has been consistently above the closing prices, indicating a short-term uptrend.
- MACD: The MACD line has been positive and above the signal line, suggesting bullish momentum.
- RSI: The RSI has been in the neutral to overbought territory, reflecting a strong buying pressure.
Key Observation: The trend indicators point towards a bullish sentiment in the short term.
Momentum Analysis:
- Stochastic Oscillator: Both %K and %D have been in the overbought zone, signaling a potential reversal.
- Williams %R: The indicator has been in the oversold region, hinting at a possible upward movement.
Key Observation: Momentum indicators suggest a mixed sentiment with a slight bias towards a bearish reversal.
Volatility Analysis:
- Bollinger Bands (BB): The bands have been narrowing, indicating decreasing volatility.
Key Observation: Volatility has been decreasing, potentially leading to a period of consolidation or a breakout.
Volume Analysis:
- On-Balance Volume (OBV): The OBV has been declining, suggesting selling pressure.
- Chaikin Money Flow (CMF): The CMF has been positive, indicating buying interest.
Key Observation: Volume indicators show a divergence in sentiment, with OBV signaling bearish pressure and CMF reflecting bullish interest.
Conclusion:
Based on the analysis of the technical indicators, the next few days' possible stock price movement for FCAL is likely to see a continuation of the bullish trend in the short term. However, the momentum indicators hint at a potential bearish reversal, so caution is advised. The decreasing volatility may lead to a period of consolidation before a possible breakout. The conflicting signals from volume indicators suggest a tug of war between buyers and sellers.
Recommendation:
- Short-term Traders: Consider taking profits as the bullish trend may face resistance.
- Long-term Investors: Monitor the momentum indicators closely for a potential trend reversal.
- Risk Management: Implement stop-loss orders to protect gains in case of a sudden downturn.
In conclusion, while the trend remains bullish, it is essential to stay vigilant and adapt to changing market dynamics. Conducting further analysis and staying informed about market developments will be crucial in making informed investment decisions.