Technical Analysis of FCEF 2024-05-10
Overview:
In analyzing the technical indicators for FCEF stock over the last 5 days, we will delve into the trend, momentum, volatility, and volume indicators to provide a comprehensive outlook on the possible stock price movement in the coming days. By examining these key aspects, we aim to offer valuable insights and recommendations for potential investors.
Trend Indicators:
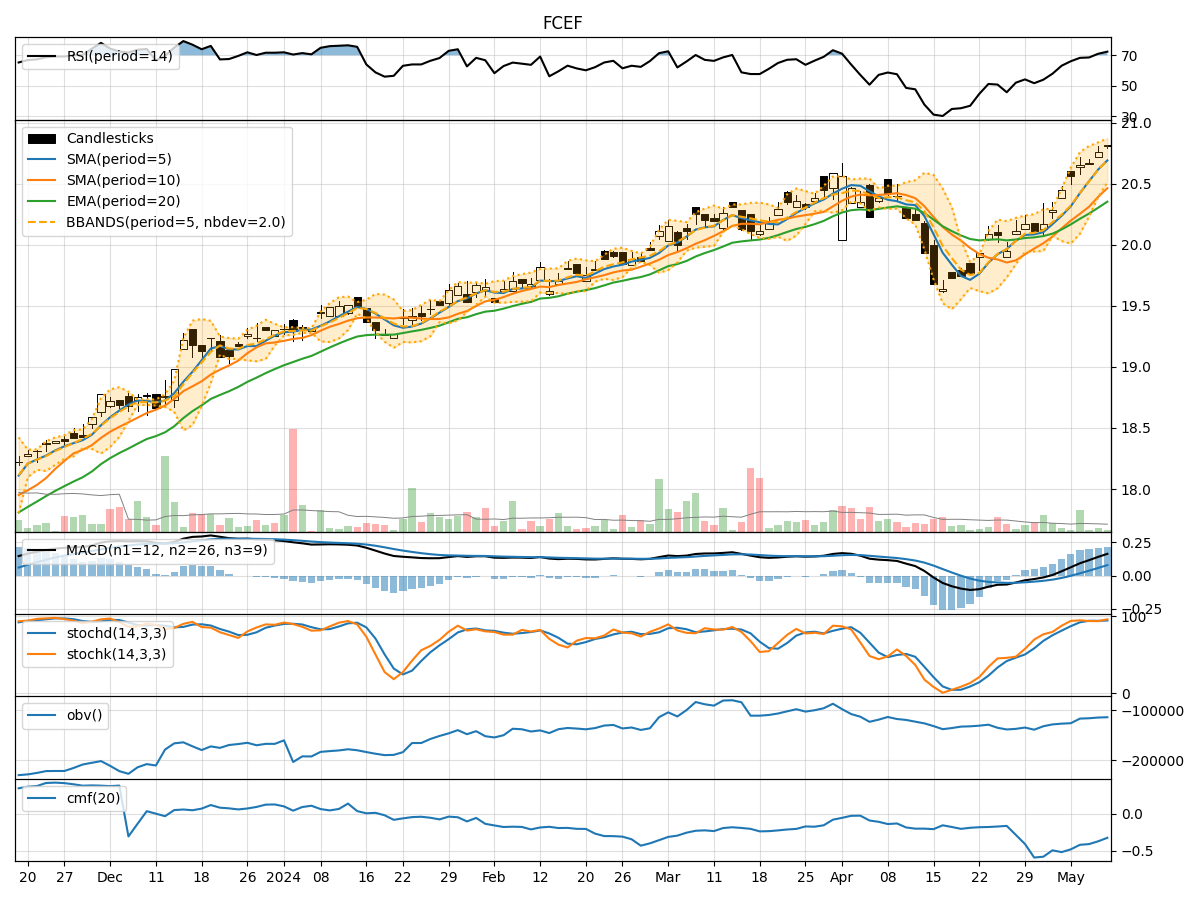
- Moving Averages (MA): The 5-day Moving Average (MA) has been consistently above the Simple Moving Average (SMA) and Exponential Moving Average (EMA), indicating a bullish trend.
- MACD: The MACD line has been consistently above the signal line, with both lines showing an upward trend, suggesting bullish momentum.
- MACD Histogram: The MACD Histogram has been increasing over the past 5 days, indicating strengthening bullish momentum.
Momentum Indicators:
- RSI: The Relative Strength Index (RSI) has been trending upwards and is currently in the overbought territory, suggesting a strong bullish momentum.
- Stochastic Oscillator: Both %K and %D lines of the Stochastic Oscillator are in the overbought zone, indicating a potential reversal or consolidation.
- Williams %R: The Williams %R is in the oversold territory, signaling a potential reversal to the upside.
Volatility Indicators:
- Bollinger Bands: The stock price has been trading within the Bollinger Bands, with the bands narrowing, indicating decreasing volatility.
- Bollinger %B: The %B indicator is above 0.8, suggesting the stock is trading near the upper band, potentially indicating an overbought condition.
Volume Indicators:
- On-Balance Volume (OBV): The OBV has been increasing over the past 5 days, indicating accumulation by investors.
- Chaikin Money Flow (CMF): The CMF is negative, suggesting a bearish money flow over the past 20 days.
Conclusion:
Based on the analysis of the technical indicators, the stock is currently exhibiting strong bullish momentum, as indicated by the moving averages, MACD, and RSI. However, the Stochastic Oscillator and Williams %R suggest a potential reversal or consolidation in the short term due to overbought conditions. The narrowing Bollinger Bands and high %B value also point towards a possible pullback or sideways movement.
Recommendation:
- Short Term: The stock may experience a short-term correction or consolidation before potentially resuming its bullish trend.
- Long Term: Considering the overall bullish trend and positive momentum indicators, the long-term outlook remains favorable.
- Risk Management: Investors should closely monitor the Stochastic Oscillator and %R for potential reversal signals and consider implementing stop-loss strategies to manage risk.
Key Conclusion:
The stock is currently in an overbought state with bullish momentum but shows signs of potential consolidation or reversal in the short term. Investors should exercise caution and consider the risk factors before making investment decisions.