Technical Analysis of FCFY 2024-05-10
Overview:
In analyzing the Technical Analysis (TA) data for FCFY over the last 5 days, we will delve into various indicators across trend, momentum, volatility, and volume to provide insights into the possible stock price movement in the upcoming days. By examining key metrics and patterns, we aim to offer a comprehensive outlook on the stock's potential trajectory.
Trend Analysis:
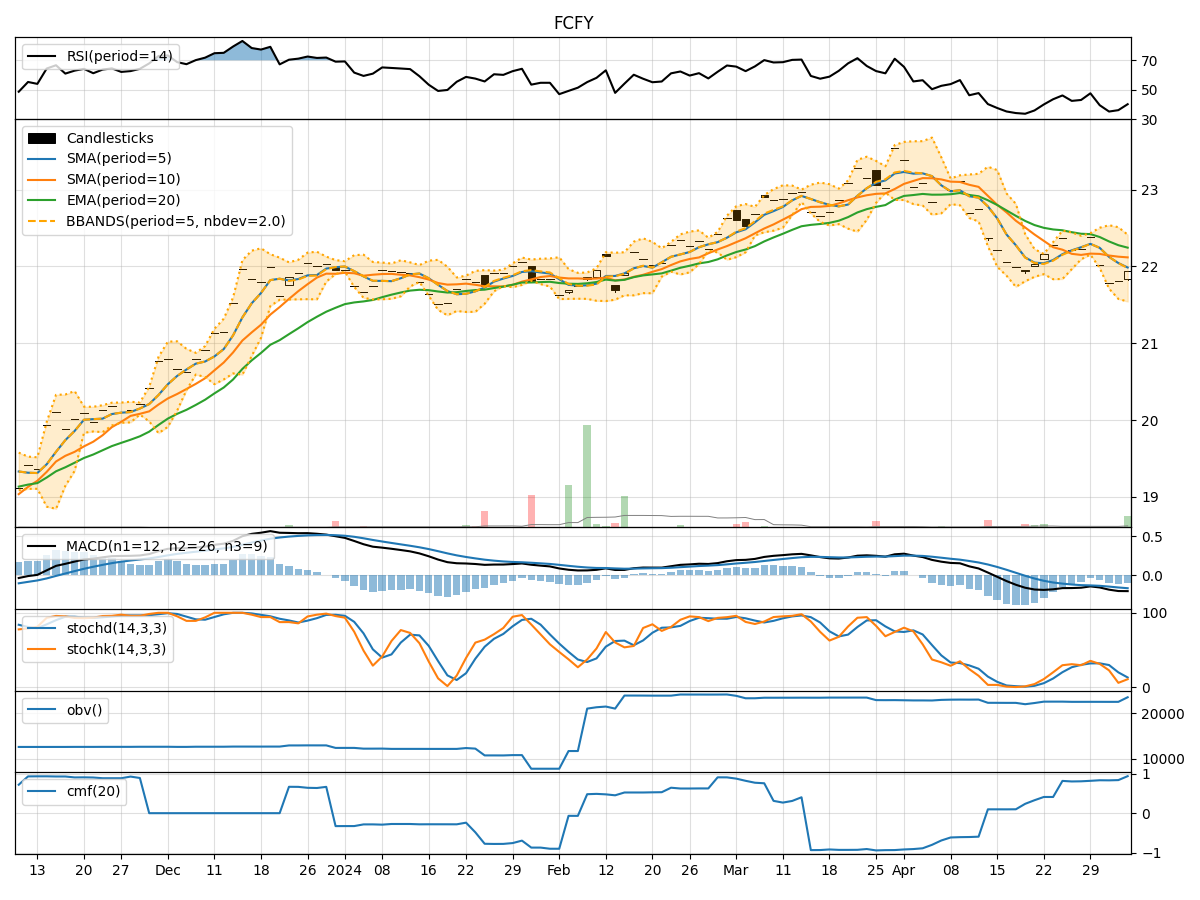
- Moving Averages (MA): The 5-day MA has been showing a slight uptrend, indicating a positive momentum in the short term.
- MACD: The MACD line has been consistently below the signal line, suggesting a bearish trend in the stock.
- EMA: The EMA has been relatively stable, reflecting a neutral stance in the stock's price movement.
Momentum Analysis:
- RSI: The RSI has been gradually increasing, indicating a strengthening momentum in the stock.
- Stochastic Oscillator: Both %K and %D have been rising, signaling a bullish momentum.
- Williams %R: The indicator has been moving towards oversold territory, suggesting a potential reversal in the stock's direction.
Volatility Analysis:
- Bollinger Bands (BB): The stock price has been trading within the bands, indicating a period of consolidation.
- BB Width: The narrowing of the bands suggests decreasing volatility in the stock.
- BB %B: The %B indicator has been hovering around the middle, reflecting a balanced market sentiment.
Volume Analysis:
- On-Balance Volume (OBV): The OBV has been steadily increasing, indicating accumulation of the stock.
- Chaikin Money Flow (CMF): The CMF has been positive, suggesting buying pressure in the stock.
Conclusion:
Based on the analysis of the technical indicators: - Trend: The stock is exhibiting a mixed trend with a slight bullish bias in the short term. - Momentum: The momentum indicators are showing signs of strength and potential upward movement. - Volatility: The stock is currently in a consolidation phase with decreasing volatility. - Volume: The increasing OBV and positive CMF indicate a bullish sentiment among investors.
Overall Assessment:
- Outlook: The stock is likely to experience upward movement in the next few days, supported by positive momentum and volume accumulation.
- Recommendation: Consider buying or holding positions in FCFY, as the technical indicators suggest a favorable outlook for the stock price.
Disclaimer:
Remember that technical analysis is not a guaranteed predictor of future price movements, and other fundamental factors can influence stock prices. It is essential to conduct thorough research and consider multiple indicators before making investment decisions. Consulting with a financial advisor is recommended for personalized guidance tailored to your investment goals and risk tolerance level.