Technical Analysis of FCOM 2024-05-10
Overview:
In analyzing the technical indicators for FCOM over the last 5 days, we will delve into the trend, momentum, volatility, and volume indicators to provide a comprehensive outlook on the possible stock price movement in the coming days. By examining these key aspects, we aim to offer valuable insights and predictions to guide investment decisions.
Trend Indicators:
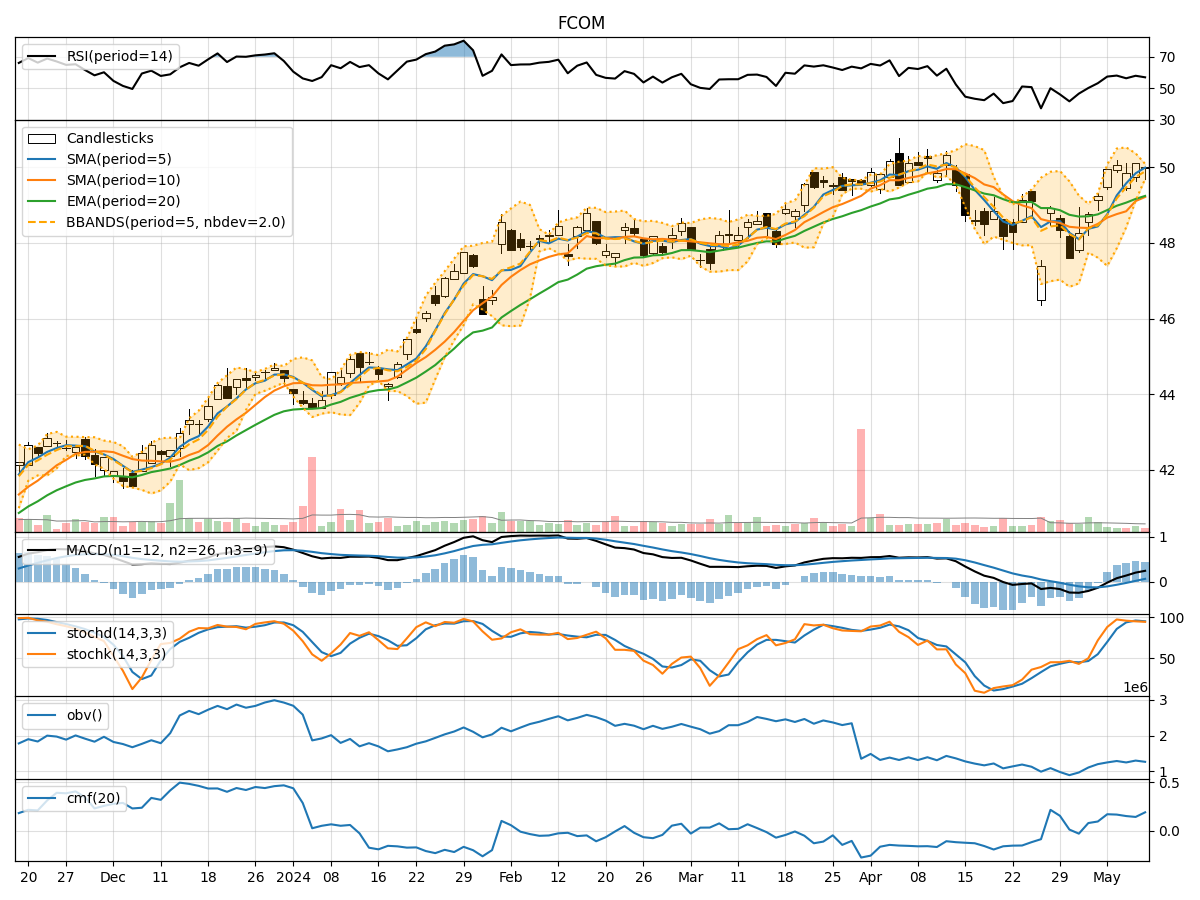
- Moving Averages (MA): The 5-day MA has been consistently above the closing prices, indicating a short-term uptrend.
- MACD: The MACD line has been above the signal line, suggesting bullish momentum.
- EMA: The exponential moving average has been trending upwards, supporting the bullish sentiment.
Key Observation: The trend indicators point towards a bullish outlook for FCOM.
Momentum Indicators:
- RSI: The Relative Strength Index has been in the overbought territory, indicating strong buying momentum.
- Stochastic Oscillator: Both %K and %D have been in the overbought zone, signaling potential price strength.
- Williams %R: The indicator has been in the oversold region, suggesting a possible reversal.
Key Observation: Momentum indicators reflect a strong bullish sentiment in the market.
Volatility Indicators:
- Bollinger Bands: The bands have been narrowing, indicating decreasing volatility.
- Bollinger %B: The %B indicator has been hovering around 0.5, suggesting a balanced market sentiment.
Key Observation: Volatility indicators point towards a period of consolidation or a potential breakout.
Volume Indicators:
- On-Balance Volume (OBV): The OBV has shown a slight decrease, indicating some distribution.
- Chaikin Money Flow (CMF): The CMF has been positive, suggesting buying pressure.
Key Observation: Volume indicators suggest a mixed sentiment with a slight bias towards buying activity.
Conclusion:
Based on the analysis of the technical indicators, the next few days for FCOM are likely to see continued upward movement in stock prices. The trend indicators, momentum indicators, and volume indicators all align to support a bullish outlook. While volatility indicators indicate a period of consolidation, the overall sentiment remains positive.
Recommendation: Considering the strong bullish momentum and positive volume flow, investors may consider buying FCOM for potential short to medium-term gains.
Key Words: Upward, Bullish Sentiment, Buying Opportunity.
By carefully considering these technical indicators and their implications, investors can make informed decisions to capitalize on the potential price movements in FCOM.