Technical Analysis of FCTR 2024-05-10
Overview:
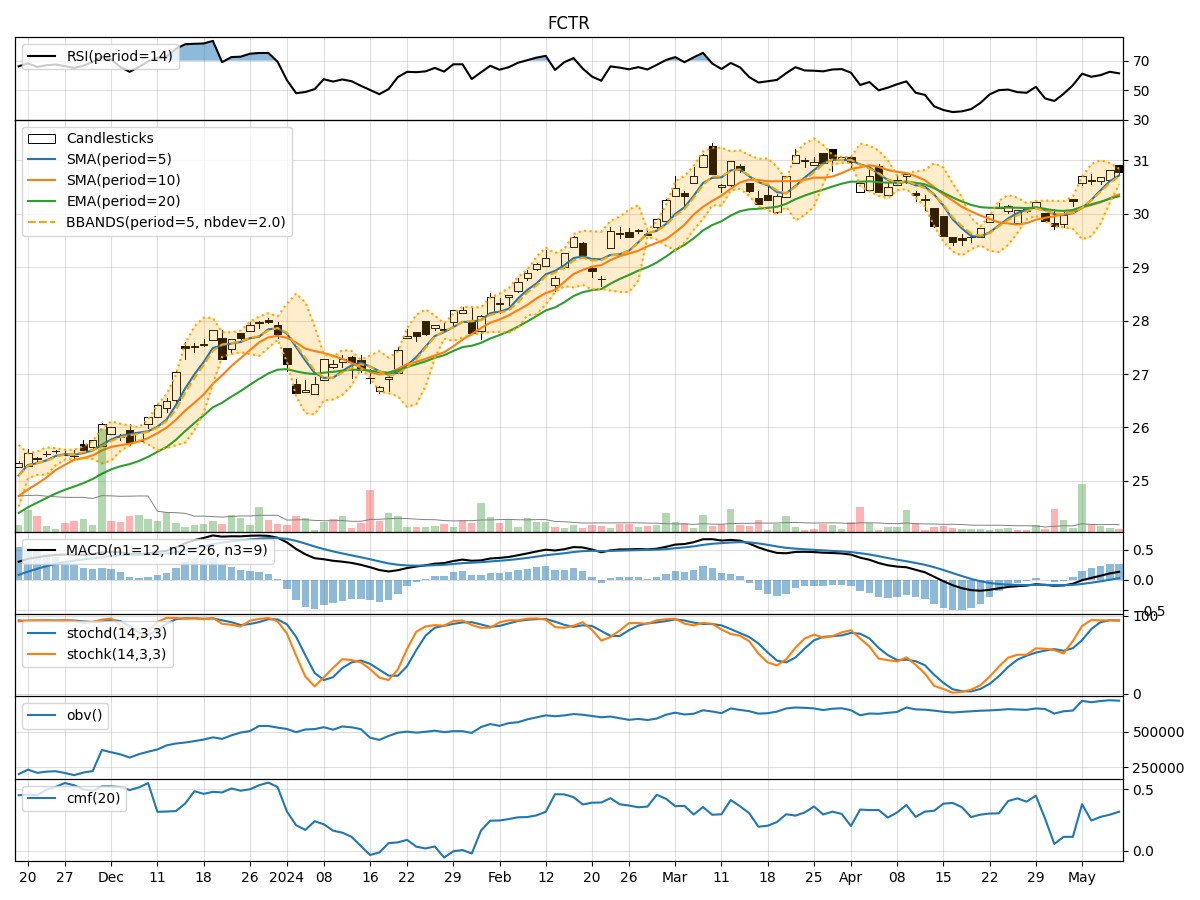
In analyzing the technical indicators for FCTR over the last 5 days, we will delve into the trend, momentum, volatility, and volume indicators to provide a comprehensive outlook on the possible stock price movement in the coming days. By examining these key indicators, we aim to offer valuable insights and predictions for potential investors.
Trend Analysis:
- Moving Averages (MA): The 5-day MA has been consistently above the closing prices, indicating a bullish trend.
- MACD: The MACD line has been above the signal line, suggesting a bullish momentum.
- Relative Strength Index (RSI): The RSI has been fluctuating around the overbought territory, indicating strong buying pressure.
Key Observation: The trend indicators point towards a bullish sentiment in the stock price movement.
Momentum Analysis:
- Stochastic Oscillator: Both %K and %D have been consistently high, indicating strong upward momentum.
- Williams %R (WillR): The indicator has been hovering in the oversold region, suggesting a potential reversal.
Key Observation: Momentum indicators reflect a bullish momentum in the stock.
Volatility Analysis:
- Bollinger Bands (BB): The bands have been narrowing, indicating decreasing volatility.
- Bollinger %B (BBP): The %B has been relatively stable around 0.7, suggesting a balanced volatility level.
Key Observation: Volatility indicators signal a consolidation phase with reduced price fluctuations.
Volume Analysis:
- On-Balance Volume (OBV): The OBV has shown a slight increase, indicating accumulation by investors.
- Chaikin Money Flow (CMF): The CMF has been positive, suggesting buying pressure in the stock.
Key Observation: Volume indicators suggest positive accumulation and buying interest in the stock.
Conclusion:
Based on the analysis of trend, momentum, volatility, and volume indicators, the overall outlook for FCTR stock price movement in the next few days is bullish. The trend indicators, momentum signals, and volume analysis all point towards a continued upward trajectory. However, the narrowing volatility suggests a potential consolidation phase before further upside movement.
Recommendation:
Considering the bullish sentiment in the technical indicators, investors may consider buying or holding positions in FCTR stock for potential gains in the coming days. It is essential to monitor the price action closely for any signs of reversal or trend continuation.
Disclaimer:
This analysis is based solely on technical indicators and historical data. It is crucial to conduct thorough research and consider other fundamental factors before making investment decisions. Market dynamics can change rapidly, so it is advisable to consult with a financial advisor for personalized guidance tailored to your risk tolerance and investment goals.