Technical Analysis of FCUS 2024-05-10
Overview:
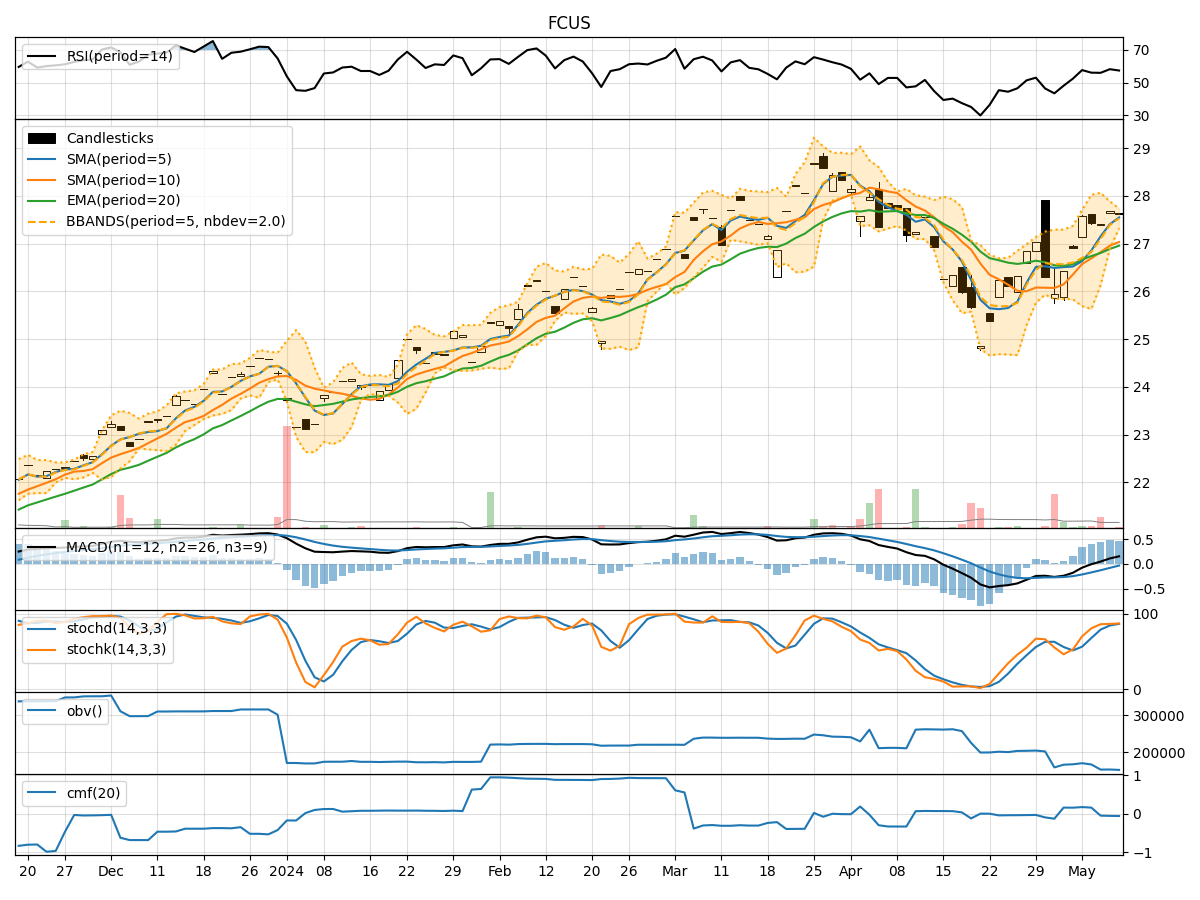
In analyzing the technical indicators for FCUS over the last 5 days, we will delve into the trend, momentum, volatility, and volume indicators to provide a comprehensive outlook on the possible stock price movement in the coming days. By examining these key indicators, we aim to offer valuable insights and predictions for potential investors.
Trend Analysis:
- Moving Averages (MA): The 5-day Moving Average (MA) has been consistently above the Simple Moving Average (SMA) and Exponential Moving Average (EMA), indicating a bullish trend.
- MACD: The MACD line has been consistently above the signal line, with both lines showing an upward trend, suggesting bullish momentum.
- RSI: The Relative Strength Index (RSI) has been fluctuating around the 50 level, indicating a neutral stance in terms of momentum.
Momentum Analysis:
- Stochastic Oscillator: Both %K and %D lines of the Stochastic Oscillator have been in the overbought zone, suggesting a potential reversal or consolidation.
- Williams %R: The Williams %R indicator has been hovering in the oversold territory, indicating a possible bullish reversal.
Volatility Analysis:
- Bollinger Bands (BB): The stock price has been trading within the Bollinger Bands, with the bands narrowing, indicating decreasing volatility.
- Bollinger %B: The %B indicator has been fluctuating around the midline, suggesting a balanced market sentiment.
Volume Analysis:
- On-Balance Volume (OBV): The OBV has been showing a slight decline, indicating some distribution happening in the stock.
- Chaikin Money Flow (CMF): The CMF has been negative, signaling a bearish money flow in the stock.
Conclusion:
Based on the analysis of the technical indicators, the next few days' possible stock price movement for FCUS could see sideways consolidation with a slight bullish bias. The bullish trend indicated by the moving averages and MACD, along with the potential bullish reversal suggested by the Williams %R indicator, may support a modest upward movement. However, the overbought signals from the Stochastic Oscillator and the negative CMF indicate a need for caution, as the stock may experience some consolidation before a clear directional move. Investors should closely monitor the price action and key support/resistance levels for better decision-making.