Technical Analysis of FDAT 2024-05-10
Overview:
In analyzing the technical indicators for FDAT over the last 5 days, we will delve into the trend, momentum, volatility, and volume indicators to provide a comprehensive outlook on the possible stock price movement in the coming days. By examining these key indicators, we aim to offer valuable insights and predictions for potential investors.
Trend Indicators:
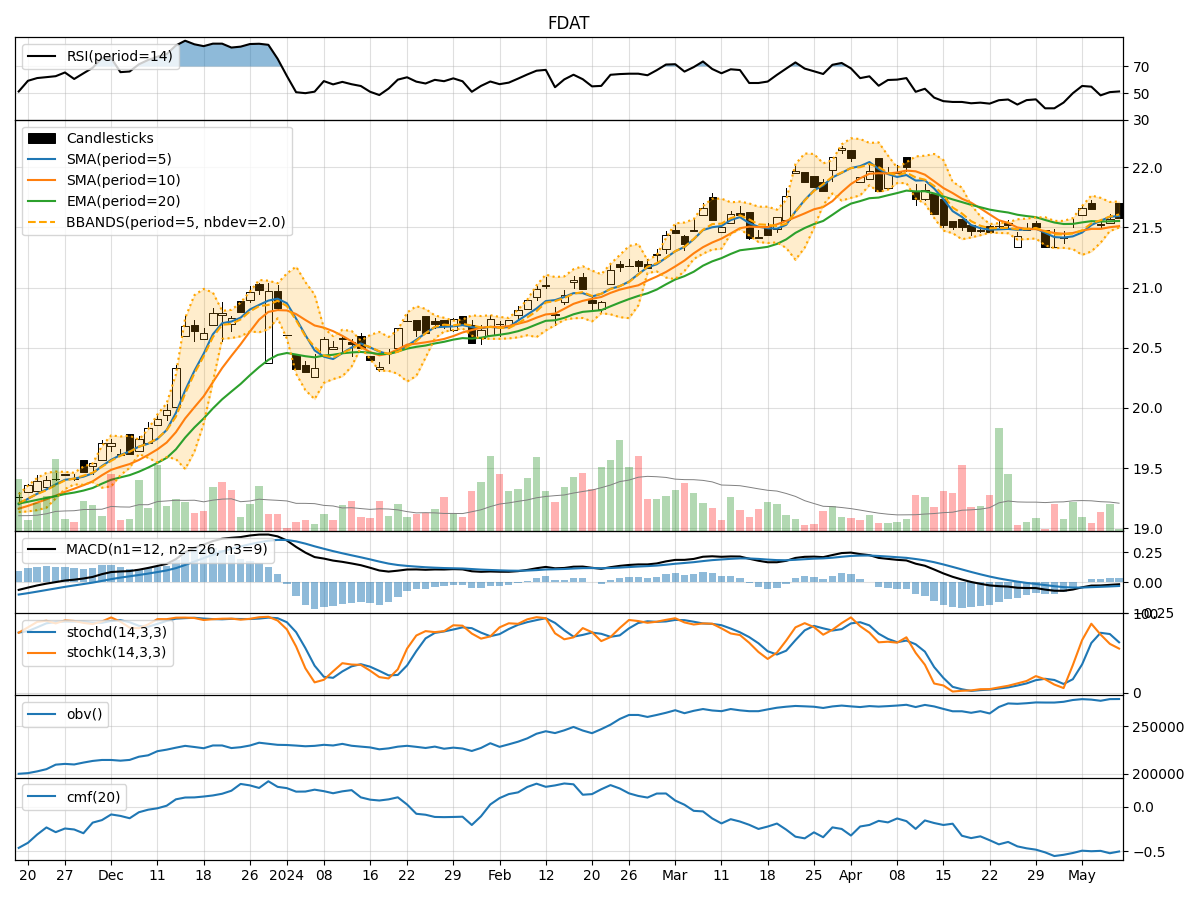
- Moving Averages (MA): The 5-day moving average has been relatively stable around the current price levels, indicating a short-term trend.
- MACD: The MACD line has been consistently negative, suggesting a bearish momentum in the stock.
- RSI: The Relative Strength Index has been fluctuating around the neutral zone, indicating a lack of strong trend direction.
Momentum Indicators:
- Stochastic Oscillator: The stochastic indicators have shown a mix of overbought and oversold conditions, reflecting a lack of clear momentum.
- Williams %R: The Williams %R has been hovering around the oversold territory, signaling a potential reversal in the short term.
Volatility Indicators:
- Bollinger Bands: The Bollinger Bands have been narrowing, indicating decreasing volatility in the stock price.
- Average True Range (ATR): The ATR has been relatively low, suggesting a lack of significant price movements.
Volume Indicators:
- On-Balance Volume (OBV): The OBV has been fluctuating, indicating indecision among market participants.
- Chaikin Money Flow (CMF): The CMF has been negative, suggesting selling pressure in the stock.
Key Observations and Opinions:
- Trend: The stock is currently in a sideways trend with no clear direction indicated by the moving averages and MACD.
- Momentum: The momentum indicators show mixed signals, with stochastic oscillators indicating potential reversals.
- Volatility: Volatility has been decreasing, which may lead to a period of consolidation or a breakout in the near future.
- Volume: The volume indicators suggest a lack of strong buying interest, with selling pressure indicated by the CMF.
Conclusion:
Based on the analysis of the technical indicators, the next few days for FDAT stock price movement are likely to be sideways with a potential for consolidation. The lack of clear trend direction, mixed momentum signals, decreasing volatility, and indecisive volume indicators point towards a period of stability in the stock price. Investors should exercise caution and wait for clearer signals before making any significant trading decisions.