Technical Analysis of FDEM 2024-05-10
Overview:
In analyzing the technical indicators for FDEM over the last 5 days, we will delve into the trend, momentum, volatility, and volume indicators to provide a comprehensive outlook on the possible stock price movement in the coming days.
Trend Analysis:
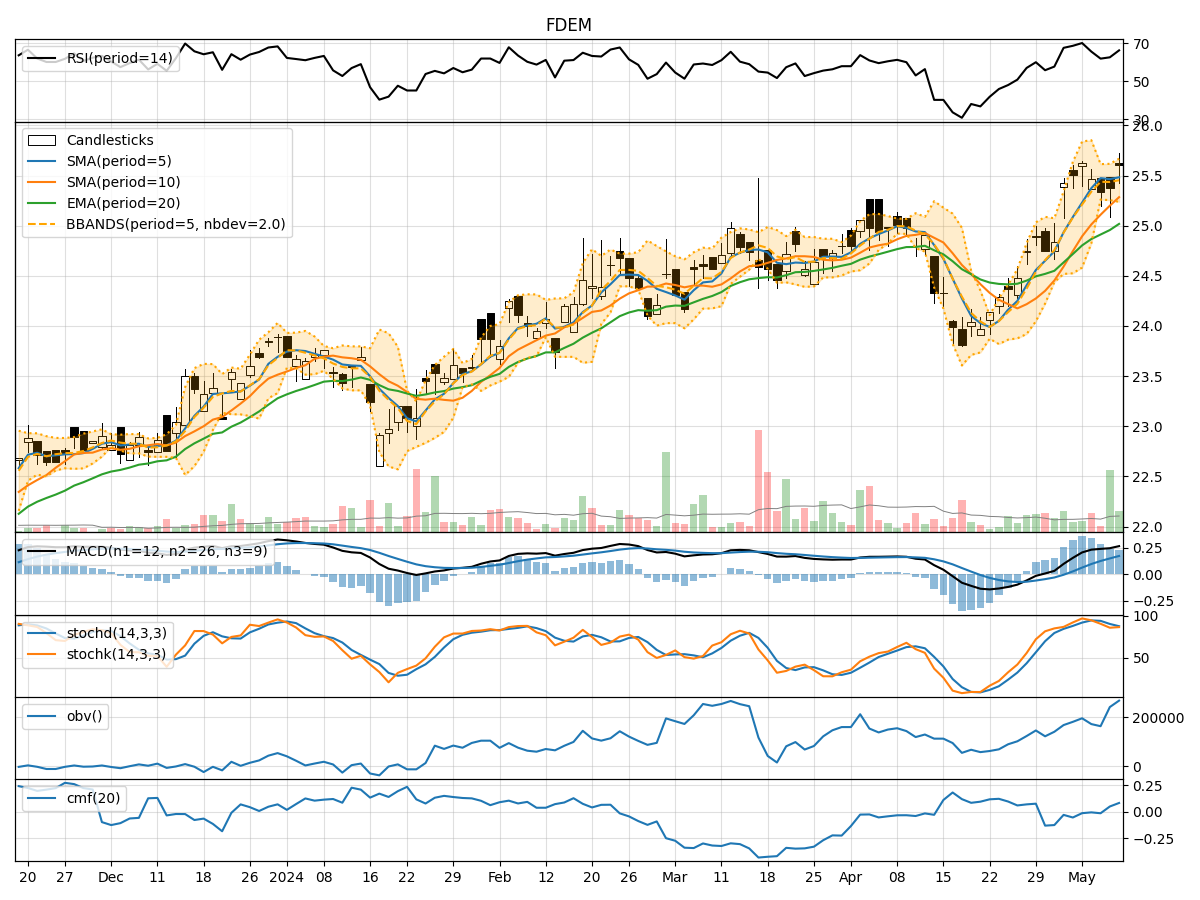
- Moving Averages (MA): The 5-day Moving Average (MA) has been consistently above the Simple Moving Average (SMA) and Exponential Moving Average (EMA), indicating a bullish trend.
- MACD: The MACD line has been consistently above the signal line, with both lines showing an upward trend, suggesting bullish momentum.
Momentum Analysis:
- RSI: The Relative Strength Index (RSI) has been fluctuating around the 60-70 range, indicating a neutral to slightly bullish momentum.
- Stochastic Oscillator: Both %K and %D have been fluctuating in the overbought territory, suggesting a potential reversal or consolidation.
Volatility Analysis:
- Bollinger Bands (BB): The stock price has been trading within the Bollinger Bands, with the bands narrowing, indicating decreasing volatility.
Volume Analysis:
- On-Balance Volume (OBV): The OBV has shown a mixed trend, with some days seeing positive volume accumulation and others showing distribution.
- Chaikin Money Flow (CMF): The CMF has been fluctuating around the zero line, indicating a balance between buying and selling pressure.
Key Observations:
- The trend indicators suggest a strong bullish sentiment in the short term.
- Momentum indicators show a potential overbought condition, signaling a need for caution.
- Volatility has been decreasing, indicating a possible period of consolidation.
- Volume indicators reflect mixed investor sentiment, with no clear accumulation or distribution pattern.
Conclusion:
Based on the analysis of the technical indicators, the stock price of FDEM is likely to experience further upward movement in the coming days, supported by the bullish trend and momentum. However, the overbought conditions and lack of clear volume accumulation signal a potential for consolidation or a minor pullback before resuming the upward trend. Traders should closely monitor the stochastic oscillator for potential reversal signals and keep an eye on volume patterns for confirmation of the price movement.