Technical Analysis of FDEV 2024-05-10
Overview:
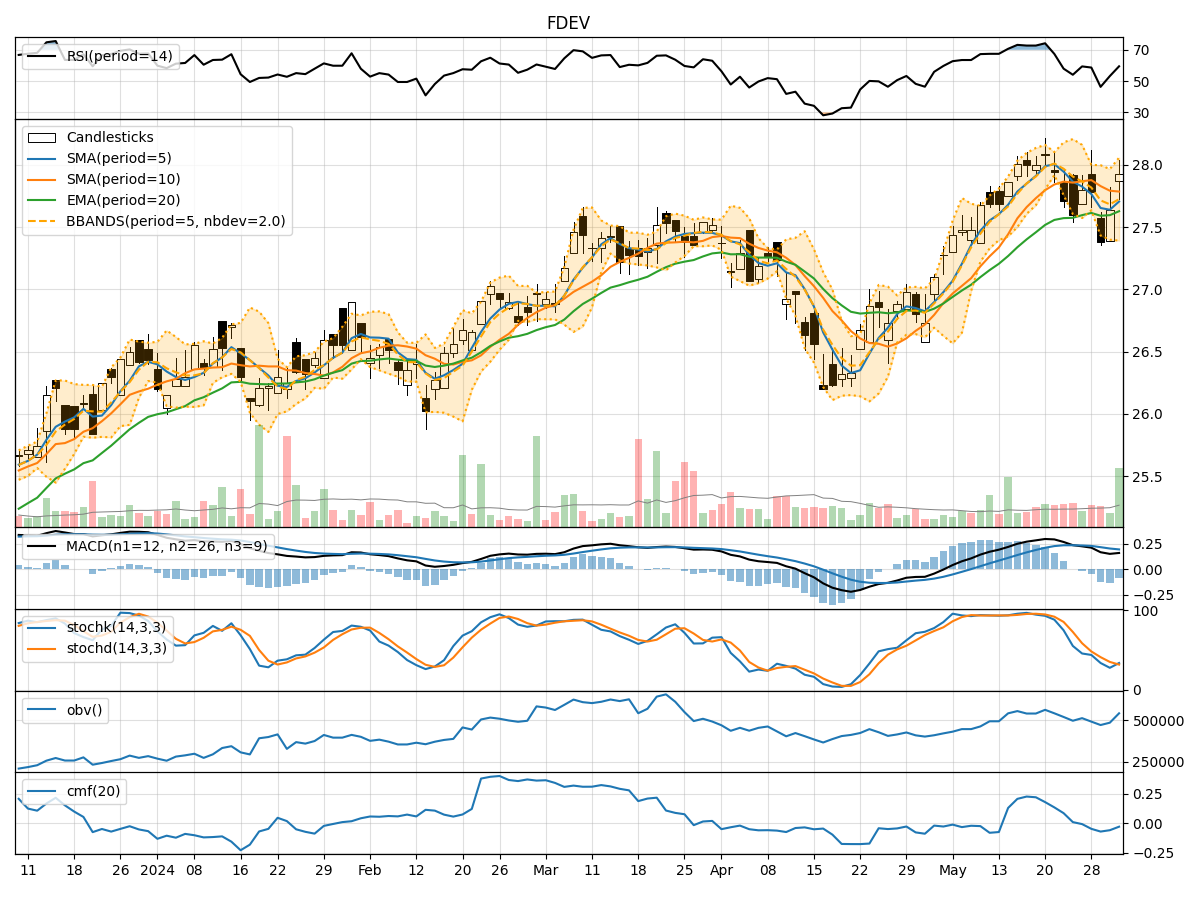
In analyzing the technical indicators for FDEV over the last 5 days, we will delve into the trend, momentum, volatility, and volume indicators to provide a comprehensive outlook on the possible stock price movement in the coming days. By examining these key aspects, we aim to offer valuable insights and predictions to guide investment decisions.
Trend Indicators:
- Moving Averages (MA): The 5-day MA has been consistently above the closing prices, indicating a bullish trend.
- MACD: The MACD line has been above the signal line, suggesting a positive momentum in the stock price.
- EMA: The EMA has been steadily increasing, reflecting a bullish sentiment in the market.
Momentum Indicators:
- RSI: The RSI values have been in the range of 60-70, indicating a moderate bullish momentum.
- Stochastic Oscillator: Both %K and %D values have been relatively high, signaling a strong buying pressure.
- Williams %R: The values have been hovering around oversold territory, suggesting a potential reversal in the stock price.
Volatility Indicators:
- Bollinger Bands: The stock price has been trading within the bands, indicating a period of consolidation.
- Bollinger %B: The %B values have been fluctuating around the midline, suggesting a balanced market sentiment.
Volume Indicators:
- On-Balance Volume (OBV): The OBV values have been increasing, indicating accumulation by investors.
- Chaikin Money Flow (CMF): The CMF values have been negative, suggesting a slight distribution phase.
Key Observations:
- The trend indicators point towards a bullish sentiment with moving averages and MACD supporting an upward trajectory.
- Momentum indicators show a moderate bullish momentum with potential for a reversal indicated by Williams %R.
- Volatility indicators suggest a period of consolidation with Bollinger Bands constriction.
- Volume indicators reflect accumulation by investors despite a slightly negative CMF.
Conclusion:
Based on the analysis of the technical indicators, the next few days for FDEV are likely to see continued upward movement in the stock price. The bullish trend supported by moving averages and MACD, coupled with the moderate bullish momentum from RSI and Stochastic Oscillator, indicates a positive outlook. Although there might be some consolidation indicated by volatility indicators, the overall sentiment remains bullish. Investors can consider buying opportunities in the coming days.