Technical Analysis of FDFF 2024-05-10
Overview:
In analyzing the technical indicators for FDFF stock over the last 5 days, we will delve into the trend, momentum, volatility, and volume indicators to provide a comprehensive outlook on the possible stock price movement in the coming days. By examining these key aspects, we aim to offer valuable insights and predictions to guide your investment decisions.
Trend Indicators:
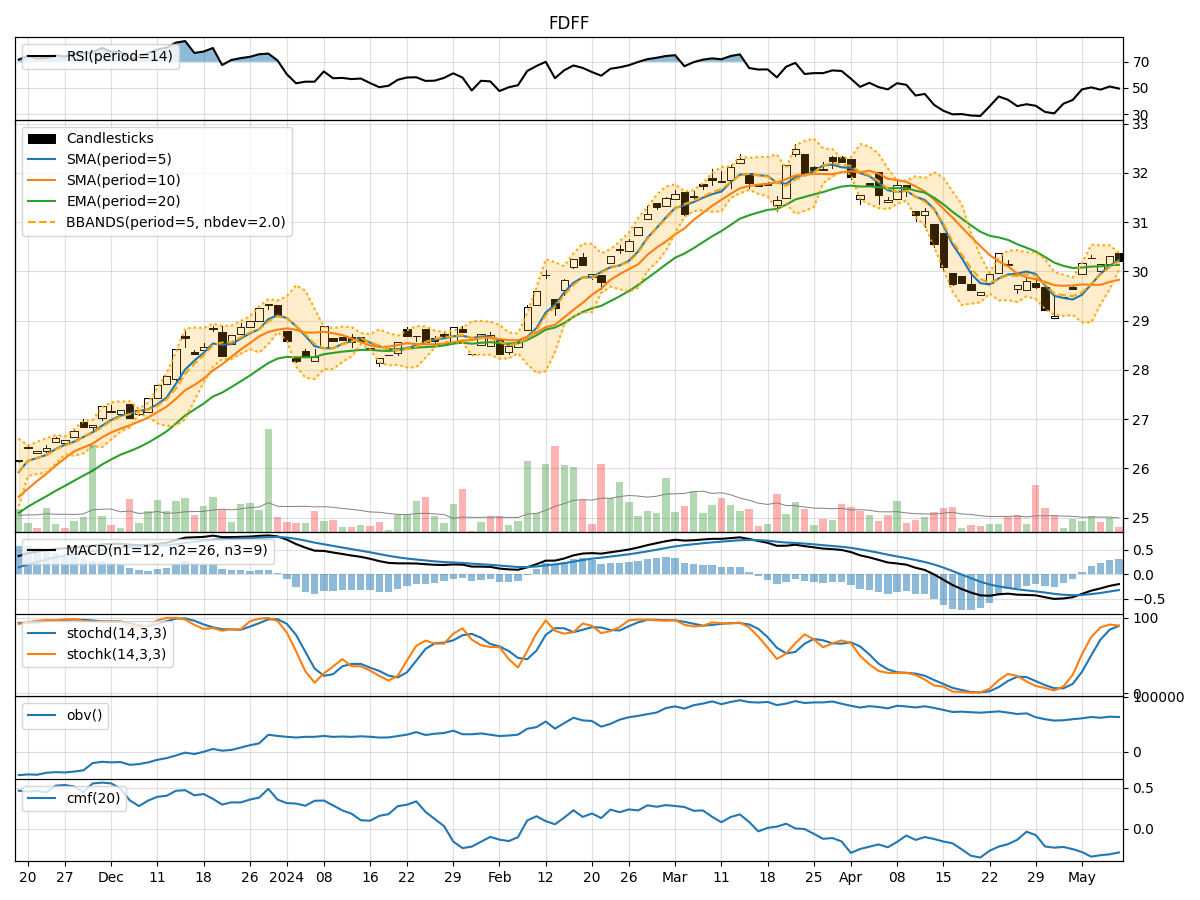
- Moving Averages (MA): The 5-day Moving Average (MA) has been steadily increasing, indicating a positive trend in the stock price.
- MACD: The Moving Average Convergence Divergence (MACD) has been consistently negative but showing signs of convergence towards the signal line, suggesting a potential reversal in the downtrend.
- EMA: The Exponential Moving Average (EMA) has been relatively stable, reflecting a gradual uptrend in the stock price.
Momentum Indicators:
- RSI: The Relative Strength Index (RSI) has been hovering around the neutral zone, indicating a balanced momentum in the stock.
- Stochastic Oscillator: Both %K and %D have been in the overbought territory, suggesting a potential reversal or consolidation in the stock price.
- Williams %R: The Williams %R is in the oversold region, indicating a possible buying opportunity in the stock.
Volatility Indicators:
- Bollinger Bands: The Bollinger Bands are narrowing, indicating decreasing volatility and a potential breakout or significant price movement in the near future.
- Bollinger %B: The %B indicator is below 1, suggesting the stock is trading below the lower Bollinger Band, potentially indicating an oversold condition.
Volume Indicators:
- On-Balance Volume (OBV): The OBV has been relatively stable, indicating a balance between buying and selling pressure in the stock.
- Chaikin Money Flow (CMF): The CMF has been negative, suggesting a net outflow of money from the stock over the past 20 days.
Conclusion:
Based on the analysis of the technical indicators, the stock is showing signs of consolidation with a potential reversal in the downtrend. The narrowing Bollinger Bands and convergence of the MACD signal line indicate a possible breakout or significant price movement in the coming days. The overbought Stochastic Oscillator and oversold Williams %R suggest a mixed sentiment among traders, possibly leading to choppy price action.
In conclusion, while the stock may experience near-term volatility, the overall trend seems to be neutral to slightly bullish. Investors should closely monitor the breakout levels indicated by the Bollinger Bands and the MACD for potential entry or exit points. It is advisable to exercise caution and wait for confirmation from multiple indicators before making significant trading decisions.