Technical Analysis of FDG 2024-05-10
Overview:
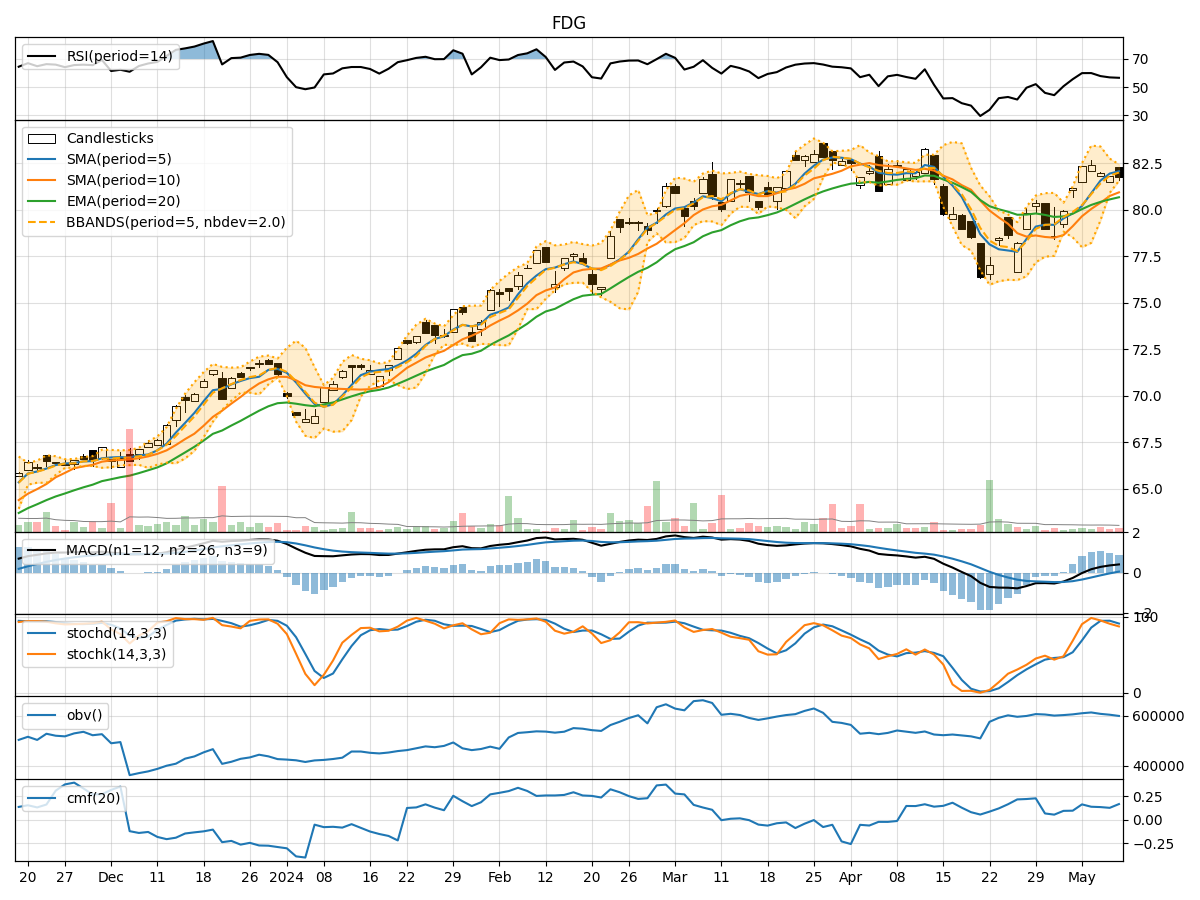
In the last 5 trading days, FDG stock has shown a consistent uptrend in its price, supported by various technical indicators. The moving averages, MACD, RSI, and Stochastic indicators all suggest a positive momentum in the stock. However, there are signs of overbought conditions in some indicators, which might indicate a potential reversal or consolidation in the near future.
Trend Analysis:
- Moving Averages (MA): The 5-day moving average has been consistently above both the simple moving average (SMA) and exponential moving average (EMA), indicating a strong bullish trend.
- MACD: The MACD line has been consistently above the signal line, showing bullish momentum in the stock price.
Key Observation: The trend indicators suggest a strong bullish trend in FDG stock.
Momentum Analysis:
- RSI: The Relative Strength Index (RSI) has been hovering around 60-70, indicating a healthy momentum without being overbought.
- Stochastic Oscillator: Both %K and %D lines of the Stochastic oscillator have been in the overbought zone, suggesting a potential reversal or consolidation.
Key Observation: Momentum indicators show a mixed signal with RSI indicating positive momentum and Stochastic suggesting a cautionary stance due to overbought conditions.
Volatility Analysis:
- Bollinger Bands (BB): The stock price has been trading within the upper Bollinger Band, indicating an overbought condition.
Key Observation: Volatility indicators suggest a potential overbought scenario, which might lead to a price correction or consolidation.
Volume Analysis:
- On-Balance Volume (OBV): The OBV has been showing a slight decrease over the last few days, indicating a divergence between price and volume.
- Chaikin Money Flow (CMF): The CMF has been positive, indicating buying pressure in the stock.
Key Observation: Volume indicators show a divergence between price and volume, which might signal a weakening of the current uptrend.
Conclusion:
Based on the analysis of the technical indicators, the next few days' possible stock price movement for FDG is likely to experience a short-term correction or consolidation. The overbought conditions in the Stochastic oscillator and Bollinger Bands, along with the divergence in volume indicators, suggest a potential reversal in the current uptrend. Traders should exercise caution and consider taking profits or implementing risk management strategies in anticipation of a possible pullback in the stock price.
Recommendation:
- Short-term Traders: Consider booking profits or implementing stop-loss orders to protect gains.
- Long-term Investors: Monitor the price action closely and consider accumulating on dips for a more favorable entry point.
Overall View: The stock is likely to experience a short-term correction or consolidation before potentially resuming its uptrend.