Technical Analysis of FDGR 2024-05-10
Overview:
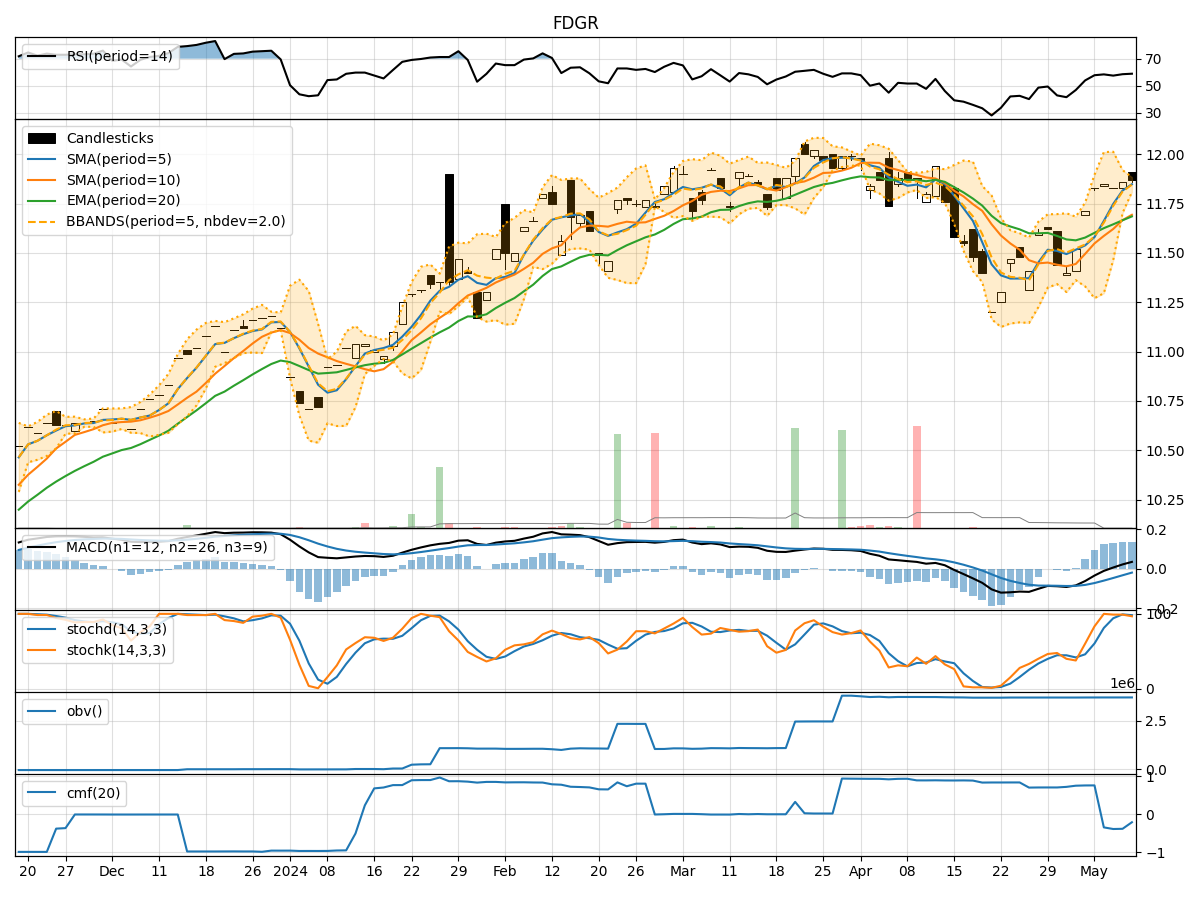
In analyzing the technical indicators for FDGR over the last 5 days, we will delve into the trend, momentum, volatility, and volume indicators to provide a comprehensive outlook on the possible stock price movement in the coming days.
Trend Indicators:
- Moving Averages (MA): The 5-day MA has been consistently above the closing prices, indicating a short-term uptrend.
- MACD: The MACD line has been above the signal line, suggesting a bullish momentum.
- EMA: The Exponential Moving Average has been trending upwards, supporting the bullish sentiment.
Momentum Indicators:
- RSI: The Relative Strength Index has been hovering around 60-70, indicating a neutral to slightly bullish momentum.
- Stochastic Oscillator: Both %K and %D have been in the overbought territory, signaling a potential reversal or consolidation.
- Williams %R: The indicator has been fluctuating around the oversold region, suggesting a mixed sentiment.
Volatility Indicators:
- Bollinger Bands: The stock price has been trading within the bands, indicating a period of consolidation.
- Bollinger %B: The %B indicator has been fluctuating around 0.8, suggesting a moderate level of volatility.
Volume Indicators:
- On-Balance Volume (OBV): The OBV has been relatively stable, indicating a balance between buying and selling pressure.
- Chaikin Money Flow (CMF): The CMF has been negative, reflecting a bearish money flow trend.
Key Observations and Opinions:
- Trend: The trend indicators suggest a bullish bias in the short term.
- Momentum: Mixed signals from momentum indicators indicate a potential reversal or consolidation.
- Volatility: The stock is currently in a consolidation phase based on Bollinger Bands.
- Volume: The volume indicators show a lack of strong buying or selling pressure.
Conclusion:
Based on the analysis of the technical indicators, the stock of FDGR is likely to experience sideways movement in the coming days. The mixed signals from momentum indicators and the consolidation pattern indicated by volatility indicators suggest a lack of clear direction. Traders may consider staying cautious and monitoring for a clearer trend to emerge before making significant trading decisions.