Technical Analysis of FDHT 2024-05-10
Overview:
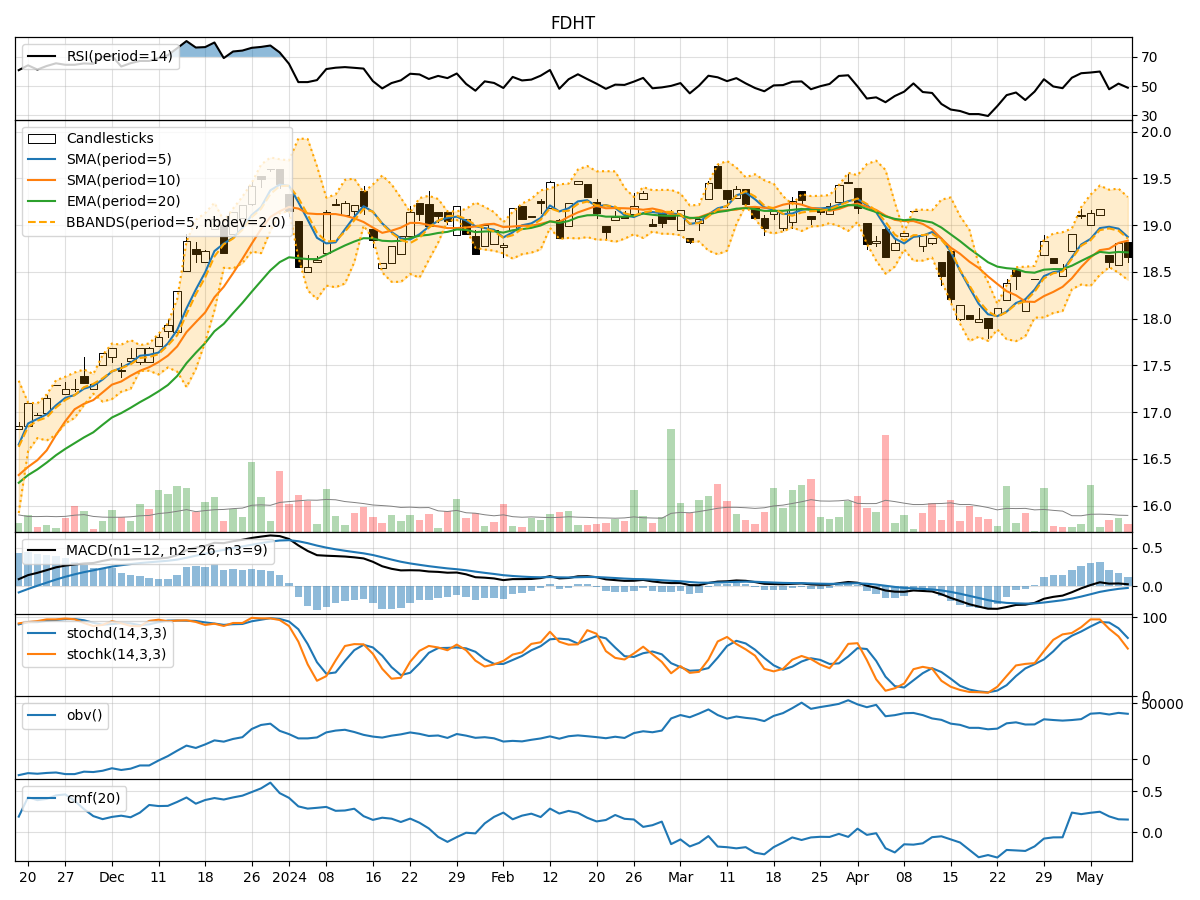
In analyzing the technical indicators for FDHT over the last 5 days, we will delve into the trend, momentum, volatility, and volume indicators to provide a comprehensive outlook on the possible stock price movement in the coming days.
Trend Analysis:
- Moving Averages (MA): The 5-day Moving Average (MA) has been fluctuating around the Simple Moving Average (SMA) and Exponential Moving Average (EMA) values, indicating a lack of clear trend direction.
- MACD: The MACD line has been positive but decreasing, while the MACD Histogram has been showing a slight decrease, suggesting a weakening bullish momentum.
Momentum Analysis:
- RSI: The Relative Strength Index (RSI) has been hovering around the mid-level, indicating a neutral momentum.
- Stochastic Oscillator: Both %K and %D values have been declining, moving towards oversold territory, signaling a potential bearish momentum shift.
- Williams %R: The Williams %R has been in the oversold region, indicating a bearish sentiment.
Volatility Analysis:
- Bollinger Bands (BB): The stock price has been trading within the Bollinger Bands, with the bands narrowing, suggesting a decrease in volatility.
Volume Analysis:
- On-Balance Volume (OBV): The OBV has been relatively stable, indicating a balance between buying and selling pressure.
- Chaikin Money Flow (CMF): The CMF has been positive but decreasing, reflecting a potential decrease in buying pressure.
Key Observations:
- The trend indicators show a lack of clear direction, with a neutral to slightly bearish bias.
- Momentum indicators suggest a potential shift towards bearish sentiment, especially with the Stochastic Oscillator and Williams %R in oversold territory.
- Volatility has been decreasing, indicating a possible period of consolidation.
- Volume indicators point towards a balanced market sentiment with a slight decrease in buying pressure.
Conclusion:
Based on the analysis of the technical indicators, the stock price of FDHT is likely to experience a downward movement in the coming days. The weakening bullish momentum, bearish signals from the Stochastic Oscillator and Williams %R, along with decreasing volatility and buying pressure, all point towards a potential bearish trend. Traders and investors should exercise caution and consider short-term selling opportunities or wait for a clearer trend confirmation before making any significant investment decisions.