Technical Analysis of FDLO 2024-05-10
Overview:
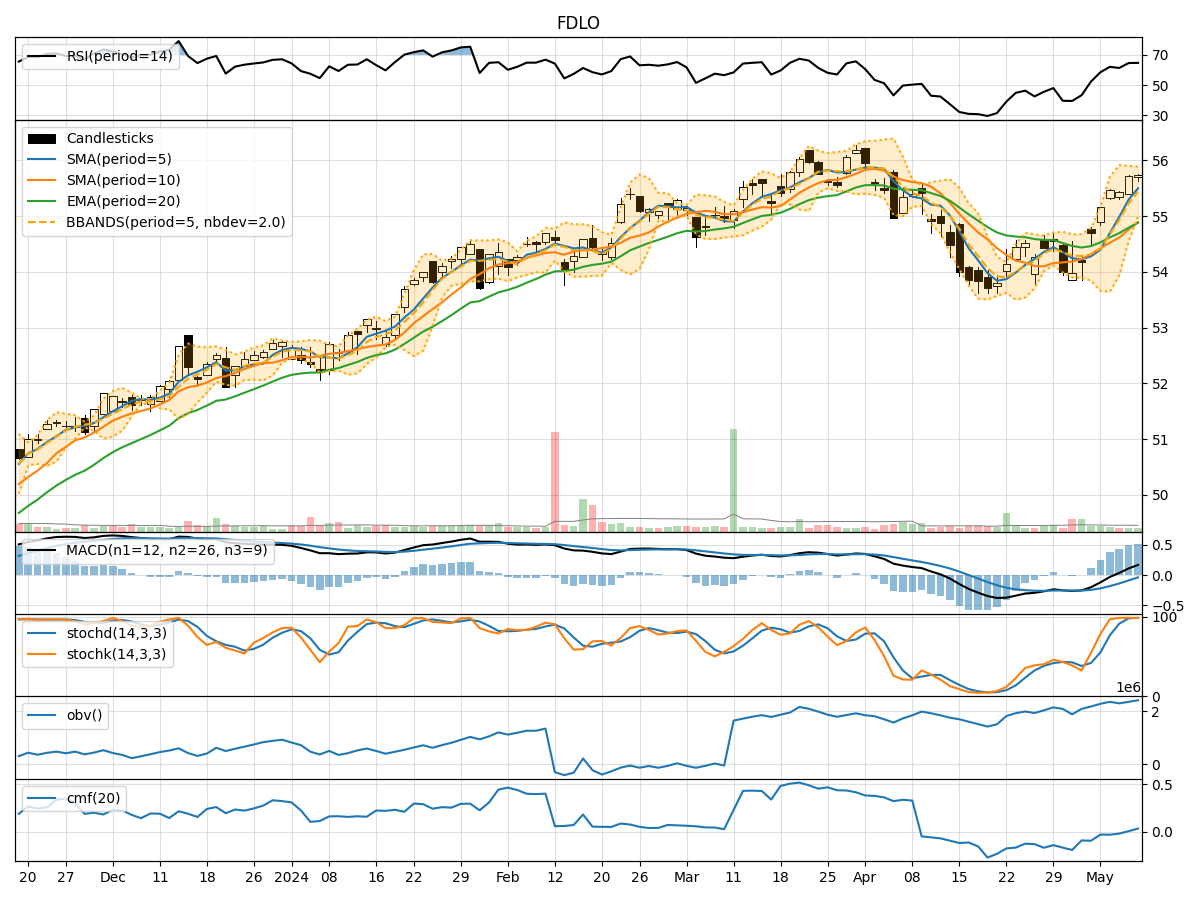
In the last 5 trading days, FDLO stock has shown a consistent uptrend in its closing price, accompanied by increasing volume. The trend indicators suggest a positive momentum with moving averages and MACD showing bullish signals. Momentum indicators like RSI and Stochastic oscillators indicate overbought conditions but still reflect strong buying pressure. Volatility indicators show a narrowing Bollinger Band width, indicating a potential breakout. Volume indicators like OBV and CMF suggest a slight increase in buying pressure.
Trend Analysis:
- Moving averages (MA) have been steadily increasing, indicating a bullish trend.
- MACD line is above the signal line, suggesting a bullish momentum.
- EMA(20) is trending upwards, supporting the bullish sentiment.
Momentum Analysis:
- RSI is in the overbought zone, indicating a potential reversal or consolidation.
- Stochastic oscillators are in the overbought region, signaling a possible pullback.
- Williams %R is also in the oversold territory, suggesting a bearish sentiment.
Volatility Analysis:
- Bollinger Bands are narrowing, indicating a potential decrease in volatility and a possible breakout.
- Bollinger Band %B is hovering around 0.8, suggesting a bullish sentiment.
Volume Analysis:
- On-Balance Volume (OBV) has been increasing, indicating accumulation by investors.
- Chaikin Money Flow (CMF) is slightly positive, showing a mild buying pressure.
Key Observations:
- The stock is currently in a strong uptrend, supported by moving averages and MACD.
- Momentum indicators suggest a potential overbought scenario, indicating a need for caution.
- Volatility is decreasing, which could lead to a breakout in either direction.
- Volume indicators show a slight increase in buying pressure, supporting the bullish bias.
Conclusion:
Based on the technical analysis of FDLO stock: - The stock is in an upward trend with strong bullish momentum. - Short-term caution is advised due to overbought conditions indicated by momentum indicators. - Volatility is contracting, signaling a potential breakout soon. - Overall, the stock is likely to continue its upward movement in the near term, but a pullback or consolidation phase may occur before further upside.
Recommendation:
- Consider taking profits if you are a short-term trader due to overbought signals.
- Long-term investors can hold with a trailing stop-loss to protect gains.
- Monitor the breakout from the narrowing Bollinger Bands for potential trading opportunities.
Disclaimer:
This analysis is based on technical indicators and historical data, and market conditions can change rapidly. It is essential to conduct thorough research and consider other factors before making investment decisions. Consulting with a financial advisor is recommended for personalized guidance tailored to your risk tolerance and investment goals.