Technical Analysis of FDLS 2024-05-10
Overview:
In analyzing the technical indicators for FDLS stock over the last 5 days, we will delve into the trend, momentum, volatility, and volume indicators to provide a comprehensive outlook on the possible stock price movement in the coming days. By examining these key indicators, we aim to offer valuable insights and predictions for potential investors and traders.
Trend Indicators:
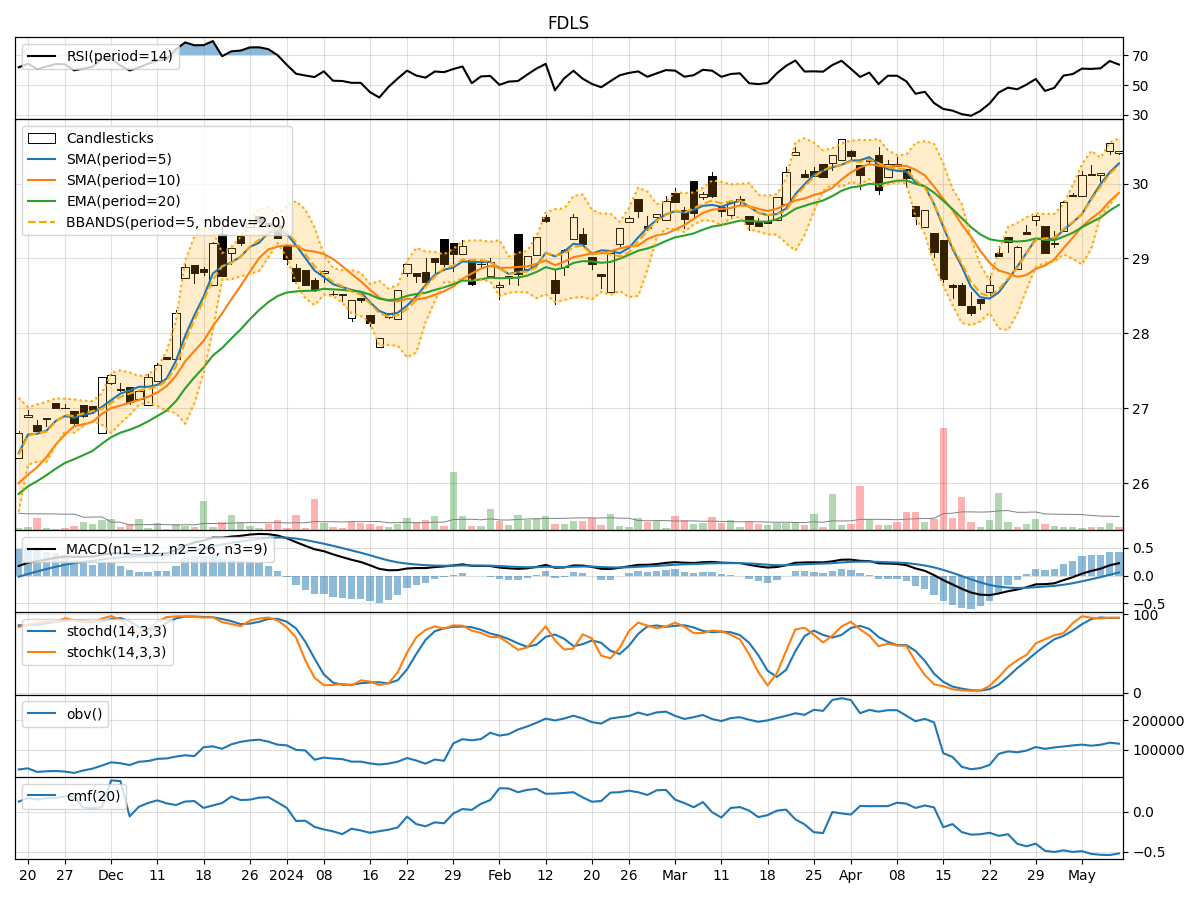
- Moving Averages (MA): The 5-day moving average has been consistently above the simple moving average (SMA) and exponential moving average (EMA), indicating a bullish trend.
- MACD: The MACD line has been consistently above the signal line, suggesting a bullish momentum in the stock price.
- MACD Histogram: The MACD histogram has been mostly positive, indicating increasing bullish momentum.
Momentum Indicators:
- RSI: The Relative Strength Index (RSI) has been fluctuating around the overbought territory, suggesting a strong bullish momentum.
- Stochastic Oscillator: Both %K and %D lines of the Stochastic Oscillator have been in the overbought zone, indicating a strong bullish sentiment.
- Williams %R: The Williams %R has been hovering in the oversold region, signaling a potential reversal to the upside.
Volatility Indicators:
- Bollinger Bands: The stock price has been trading within the Bollinger Bands, with the bands narrowing, indicating decreasing volatility.
- Bollinger %B: The %B indicator has been fluctuating around 0.7, suggesting the stock is trading close to the upper band.
Volume Indicators:
- On-Balance Volume (OBV): The OBV has been mostly negative, indicating distribution and selling pressure in the stock.
- Chaikin Money Flow (CMF): The CMF has been consistently negative, reflecting a lack of buying interest in the stock.
Key Observations and Opinions:
- Trend: The trend indicators suggest a strong bullish sentiment in the stock price.
- Momentum: Momentum indicators also support the bullish outlook, with RSI and Stochastic Oscillator signaling overbought conditions.
- Volatility: Volatility has been decreasing, potentially indicating a period of consolidation.
- Volume: The negative OBV and CMF suggest a lack of buying interest and potential downward pressure on the stock price.
Conclusion:
Based on the analysis of the technical indicators, the next few days' possible stock price movement for FDLS is likely to continue in an upward direction. The bullish trend and momentum indicators, coupled with decreasing volatility, suggest that the stock may experience further price appreciation. However, caution is advised due to the negative volume indicators, which could lead to short-term fluctuations. Investors should monitor the price action closely and consider potential profit-taking opportunities as the stock price continues its upward trajectory.