Technical Analysis of FDNI 2024-05-10
Overview:
In analyzing the technical indicators for FDNI over the last 5 days, we will delve into the trend, momentum, volatility, and volume indicators to provide a comprehensive outlook on the possible stock price movement in the coming days. By examining these key aspects, we aim to offer valuable insights and predictions to guide your investment decisions.
Trend Analysis:
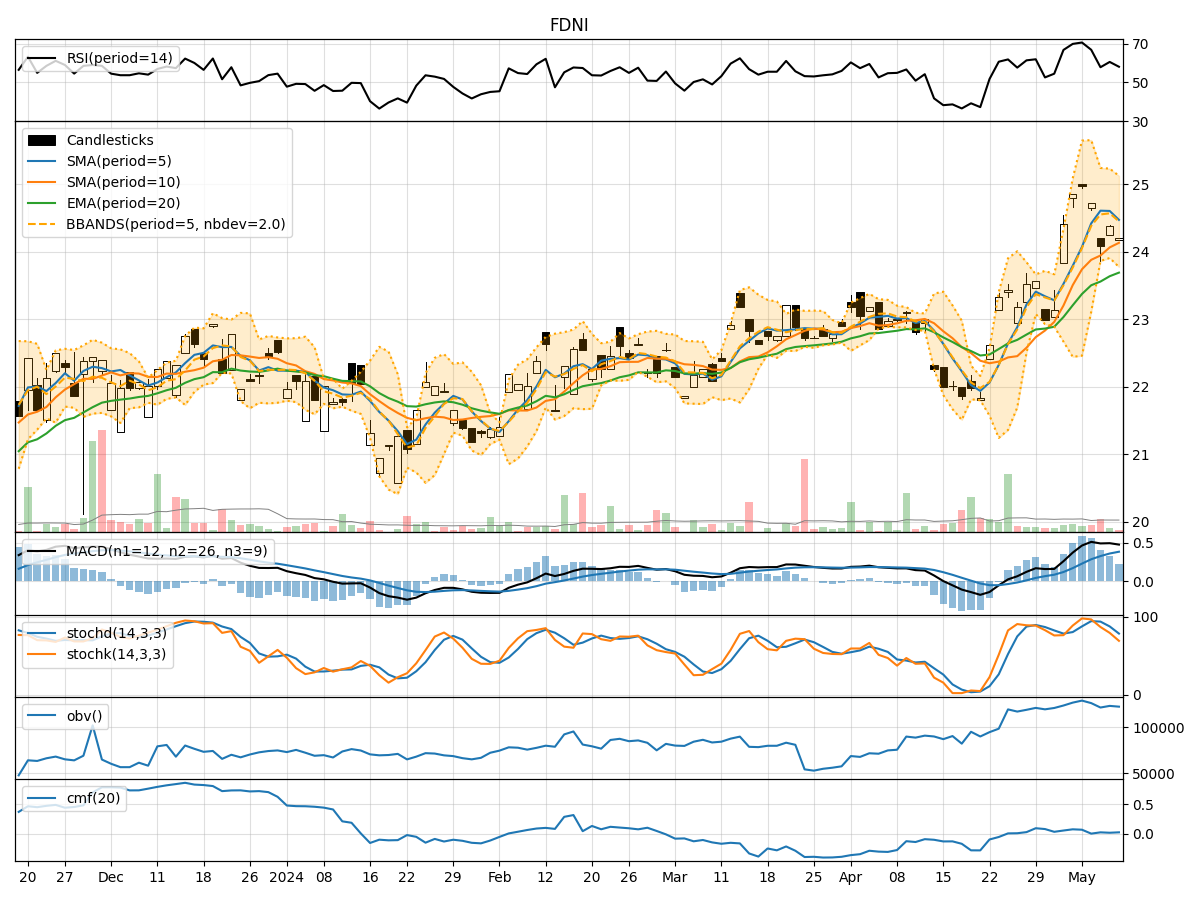
- Moving Averages (MA): The 5-day MA has been consistently above the 10-day SMA, indicating a short-term bullish trend.
- Exponential Moving Average (EMA): The EMA has been trending upwards, suggesting a positive momentum in the stock price.
- MACD: The MACD line has been above the signal line, reflecting a bullish trend in the stock.
Key Observation: The trend indicators point towards a bullish sentiment in the stock price.
Momentum Analysis:
- RSI: The RSI has been fluctuating around the 50 level, indicating a neutral momentum in the stock.
- Stochastic Oscillator: Both %K and %D have been declining, signaling a potential reversal in momentum.
- Williams %R (WillR): The WillR is in oversold territory, suggesting a possible upcoming bullish momentum.
Key Observation: Momentum indicators are mixed, with a slight bias towards a potential bullish reversal.
Volatility Analysis:
- Bollinger Bands (BB): The stock price has been trading within the bands, indicating a period of consolidation.
Key Observation: Volatility indicators suggest a period of consolidation in the stock price.
Volume Analysis:
- On-Balance Volume (OBV): The OBV has been relatively stable, indicating a balance between buying and selling pressure.
- Chaikin Money Flow (CMF): The CMF has been positive, suggesting a bullish money flow into the stock.
Key Observation: Volume indicators reflect a neutral to slightly bullish sentiment in the stock.
Conclusion:
Based on the analysis of the technical indicators, the stock FDNI is likely to experience sideways consolidation in the near term, with a potential bullish reversal in momentum. The trend indicators support a bullish outlook, while volatility and volume indicators point towards a period of consolidation. Traders may consider monitoring key support and resistance levels for potential entry and exit points, while keeping a close eye on momentum indicators for any signs of a trend reversal.
In conclusion, the overall outlook for FDNI suggests a potential bullish bias in the coming days, with a need for cautious monitoring of key technical levels to confirm the anticipated price movements.