Technical Analysis of FDT 2024-05-10
Overview:
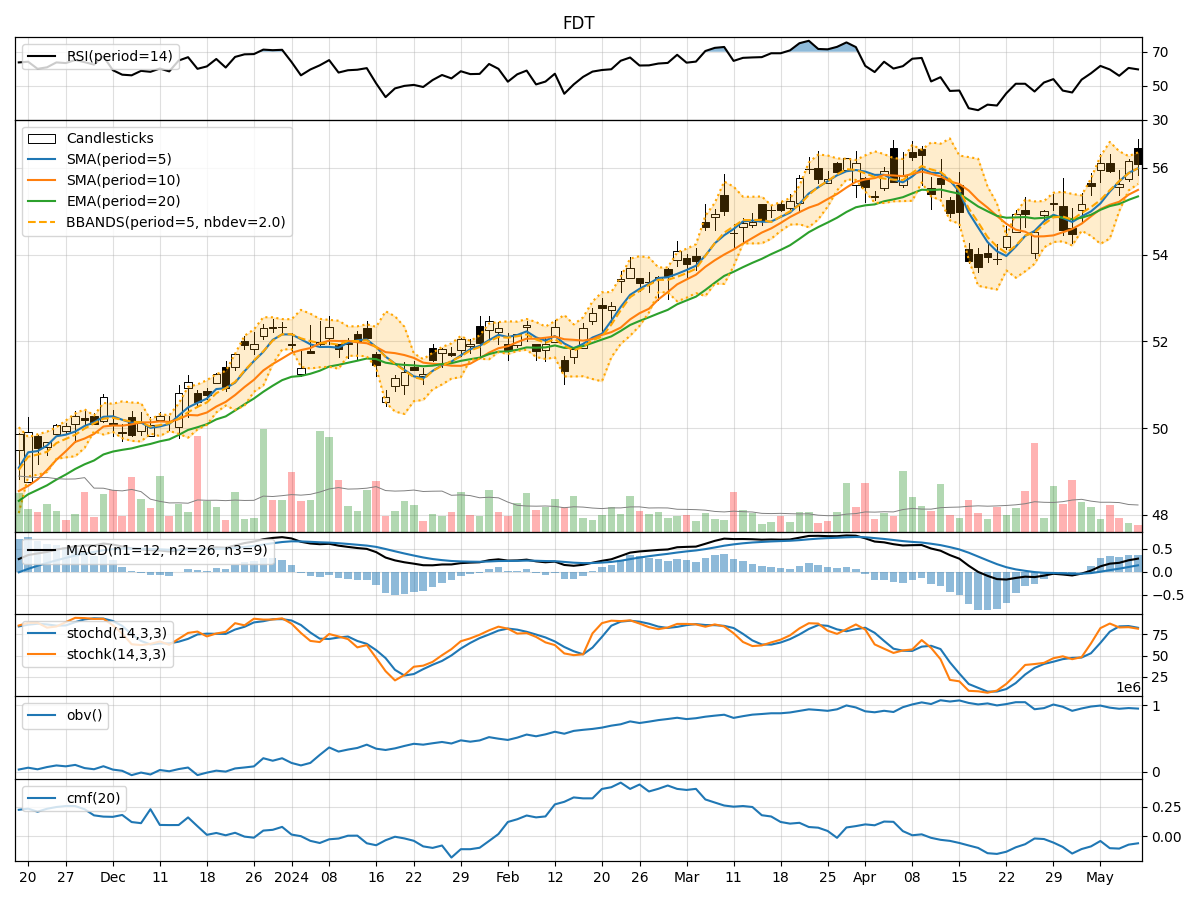
In analyzing the technical indicators for FDT stock over the last 5 days, we will delve into the trends, momentum, volatility, and volume aspects to provide a comprehensive outlook on the possible stock price movement in the coming days. By examining key indicators such as moving averages, MACD, RSI, Bollinger Bands, and OBV, we aim to offer valuable insights and predictions for informed decision-making.
Trend Analysis:
- Moving Averages (MA): The 5-day MA has been consistently above the closing prices, indicating an upward trend in the short term.
- MACD: The MACD line has been above the signal line for the past 5 days, with both lines showing an upward trajectory, suggesting bullish momentum.
- EMA: The EMA(20) has been steadily increasing, supporting the bullish sentiment in the market.
Momentum Analysis:
- RSI: The RSI has been fluctuating but generally staying above 50, indicating bullish momentum in the stock.
- Stochastic Oscillator: Both %K and %D have been in the overbought zone, suggesting a strong bullish momentum.
- Williams %R: The Williams %R has been consistently in the oversold territory, indicating a potential reversal in the stock price.
Volatility Analysis:
- Bollinger Bands: The stock price has been trading within the upper and lower bands, indicating moderate volatility in the market.
- Bollinger %B: The %B indicator has been fluctuating around 0.5, suggesting a balanced market sentiment.
Volume Analysis:
- On-Balance Volume (OBV): The OBV has been fluctuating but generally showing a slight decrease, indicating some distribution happening in the stock.
- Chaikin Money Flow (CMF): The CMF has been negative, suggesting selling pressure in the market.
Conclusion:
Based on the technical analysis of FDT stock: - Trend: The stock is in an upward trend supported by moving averages and MACD. - Momentum: The momentum indicators suggest a strong bullish sentiment in the market. - Volatility: The stock is experiencing moderate volatility based on Bollinger Bands. - Volume: The volume indicators show mixed signals with a slight decrease in OBV and negative CMF.
Overall Assessment:
Considering the overall technical indicators and analysis, the next few days for FDT stock are likely to see a continuation of the upward trend with strong bullish momentum. Traders and investors may consider buying opportunities in the stock, keeping a close watch on key support and resistance levels for potential entry and exit points. It is essential to monitor the price action closely and adjust strategies accordingly to capitalize on the expected price movement.
Key Recommendations:
- Consider buying positions in FDT stock for potential short to medium-term gains.
- Set stop-loss orders to manage risk in case of unexpected price reversals.
- Monitor key technical levels such as moving averages and support/resistance zones for strategic decision-making.
By incorporating these recommendations and staying informed about market developments, traders can navigate the FDT stock with a well-informed and proactive approach to maximize their investment potential.